
Geospatial analysis can even be an image analysis. We can obtain useful information by analyzing georeferenced, multispectral images. The current article presents the calculation of NDVI and NDWI indices that can be used in agriculture. During the image analysis, we present the images of the Sentinel-2 satellite family, but the described geospatial analysis takes place in a similar way even during a drone multispectral recording.
I used QGIS 3.14 for image analysis. If the analysis doesn’t run with the newest version, try it with my version.
Data used for image analysis
So, let’s start this with describing the source of data, the Sentinel-2 satellites. Sentinel-2 is a part of the Copernicus Program of the European Union. It takes images of lands and coastal areas of Earth in high geospatial resolution (10 to 60 meters). The Sentinel-2 program consists of 2 simultaneously working twin-satellites (Sentinel-2A and Sentinel-2B). They take pictures in visible light and close infra-red ranges (in 13 bands). The mission supports a high range of applications and services, like agricultural monitoring activity, emergencies management, land use, land cover classification or water quality. Sentinel-2 was developed and operated by the European Space Agency (ESA).
Data preparation in QGIS
On the website of ESA free satellite images are available after registering. Image processing can be done in QGIS afterwards.
Important to mention that your registration goes live 24 hours after registering, so you will be able to use the database after that time.
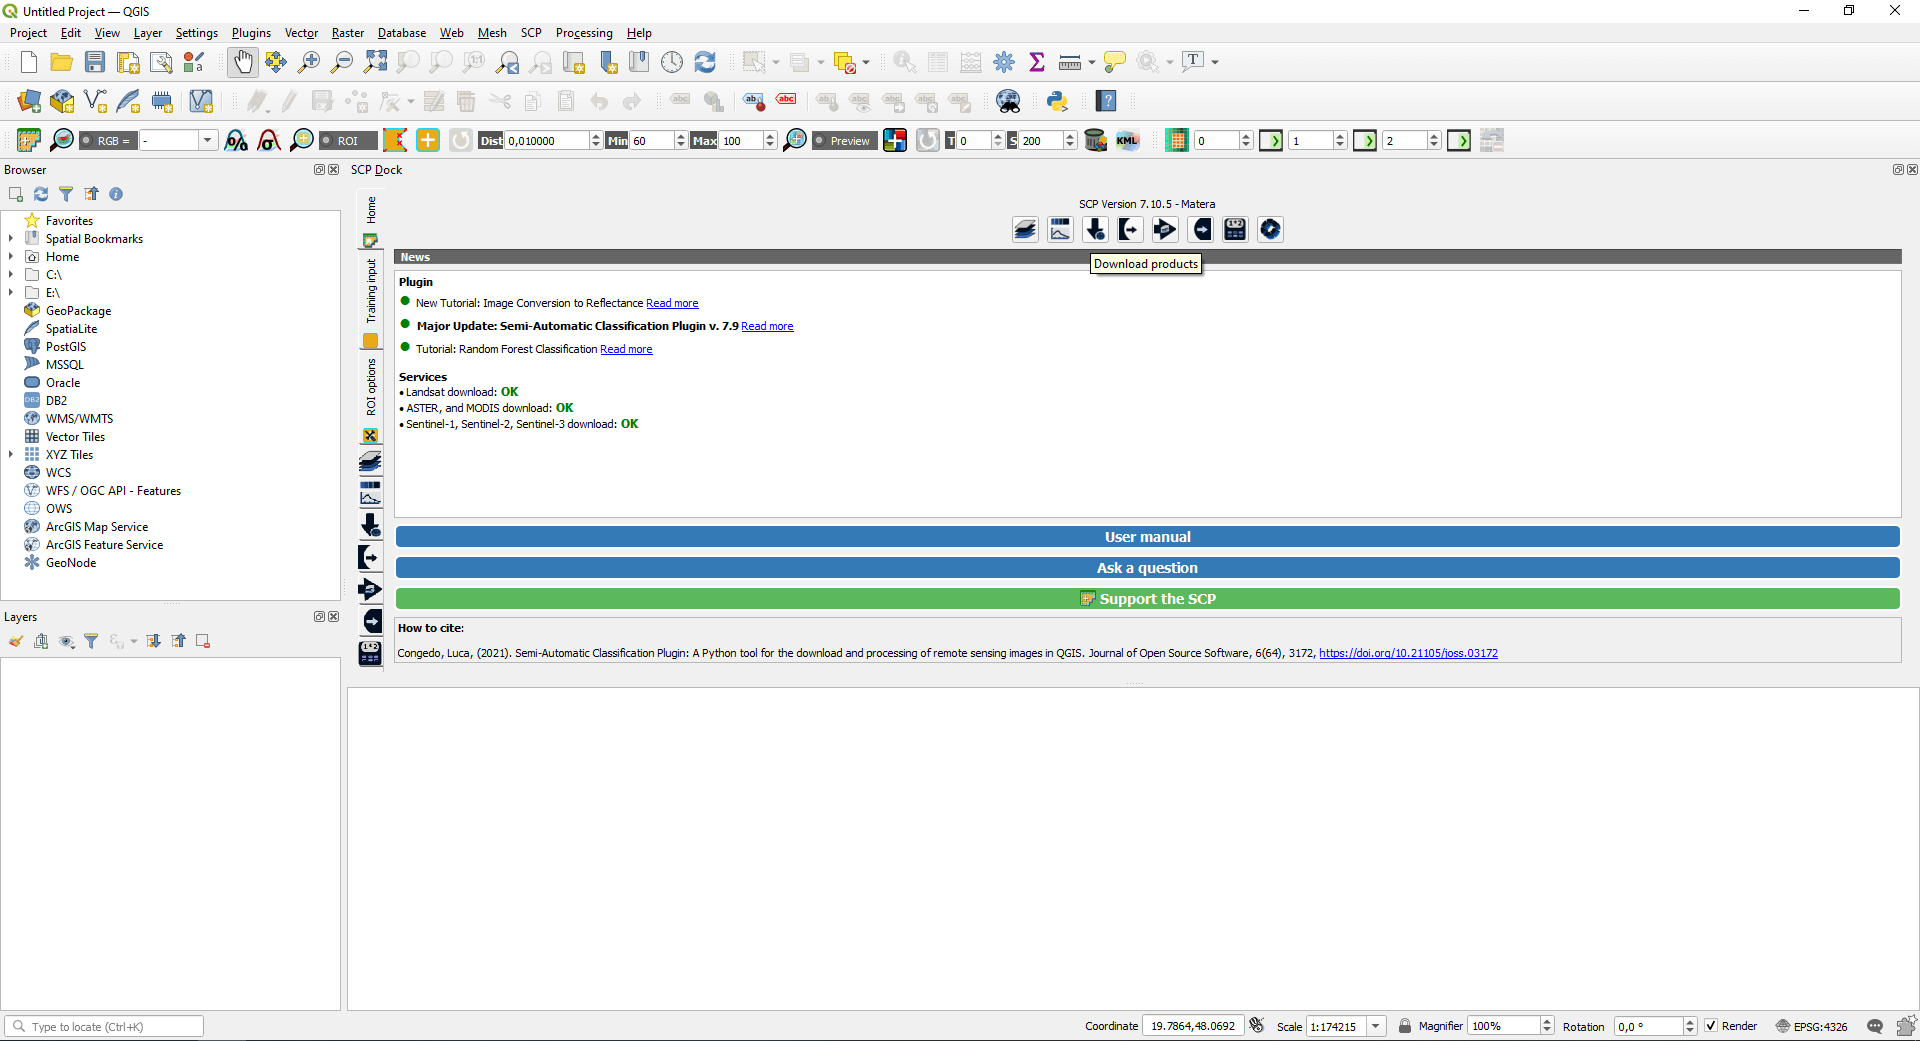
After our registration is approved, in QGIS in the “Plugins” menu we choose “Manage and Install Plugins”. Here we search for “Semi-Automatic Classification” and install the first hit. The plugins will start automatically, and you will find a bunch of new icons on the QGIS interface. Don’t worry, image analysis will be easy! Move the window away from the top left corner with “drag and drop”, to make it a bit more visible. On the interface of the plugin first we can connect to the data of Sentinel-2. To do this, click on “Download products”.
Under the “Login data” tab at “Login Sentinels” you need to give your nickname and password. Under the “Search” tab we need to define the search area by giving its corner coordinates (EPSG:3857). By clicking on the “OSM” button, the base map of OpenStreetMap will appear. On that you can select the search area by clicking on “Set area in the map”.
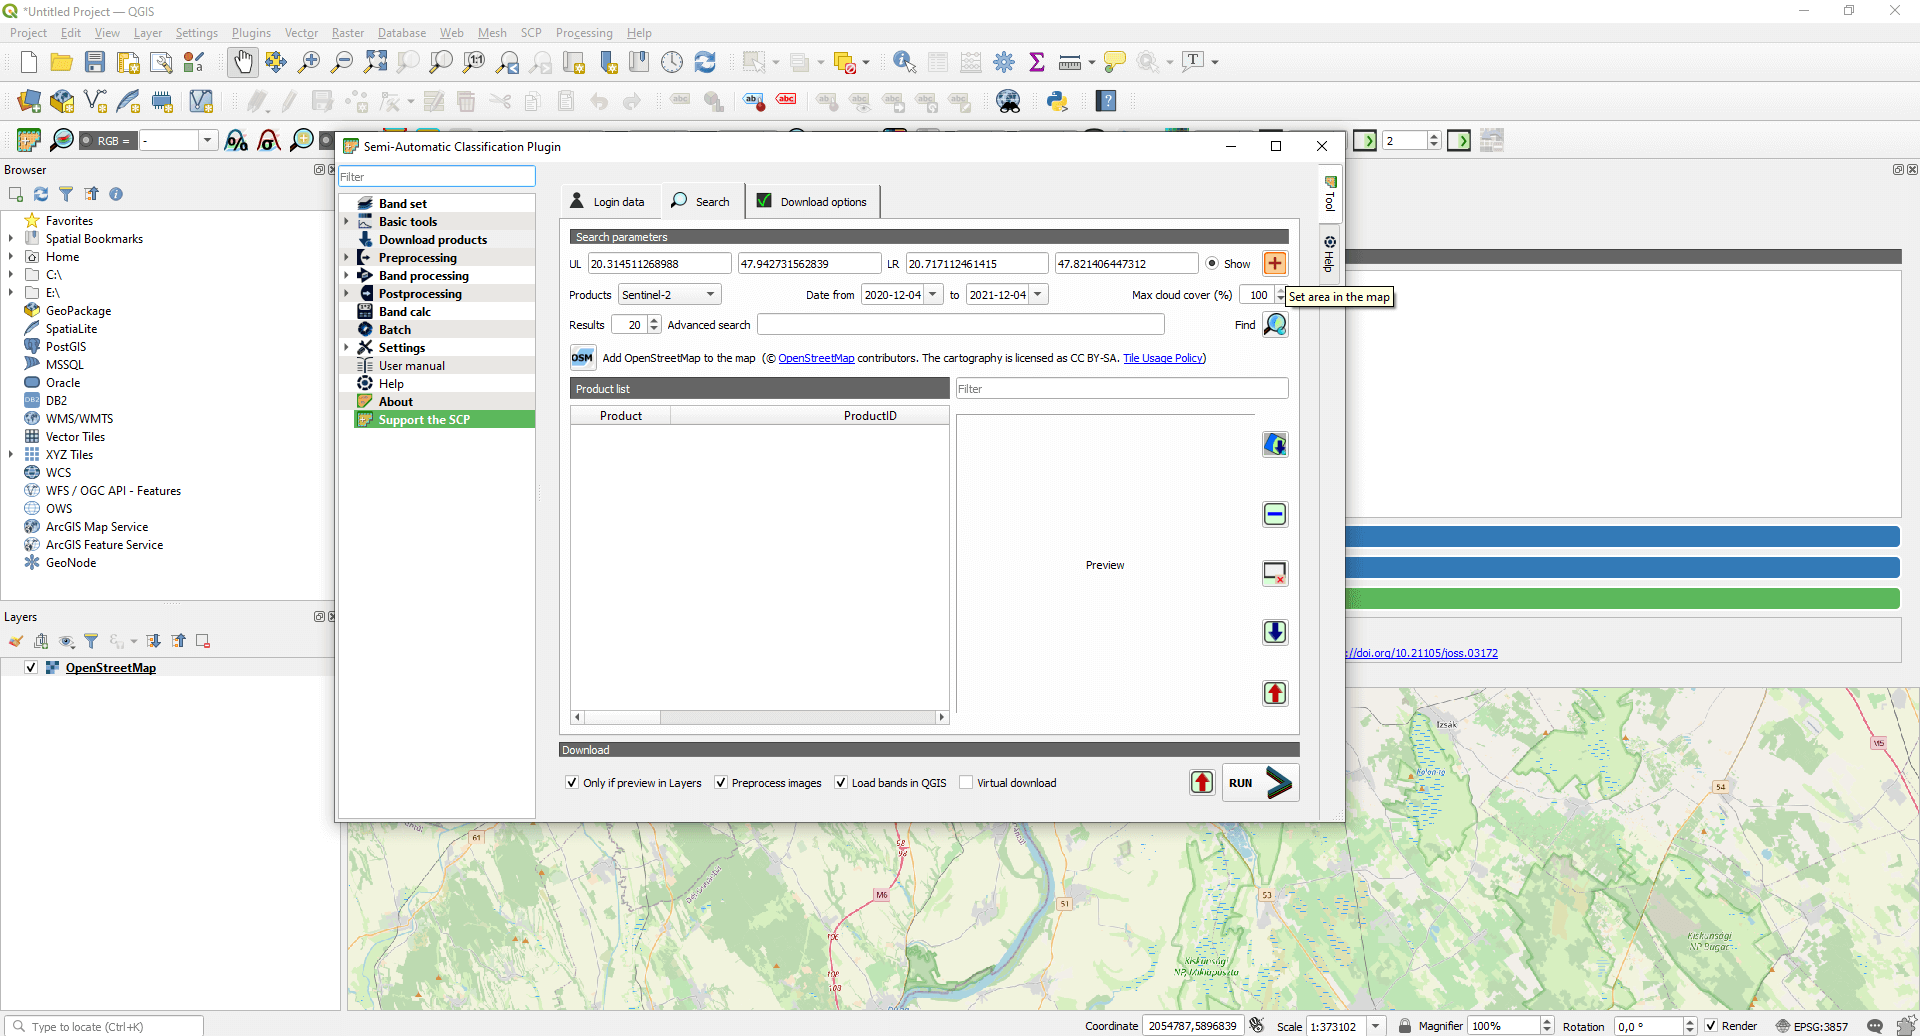
We can set the date range and it’s also available to filter those images with optimal cloud cover.
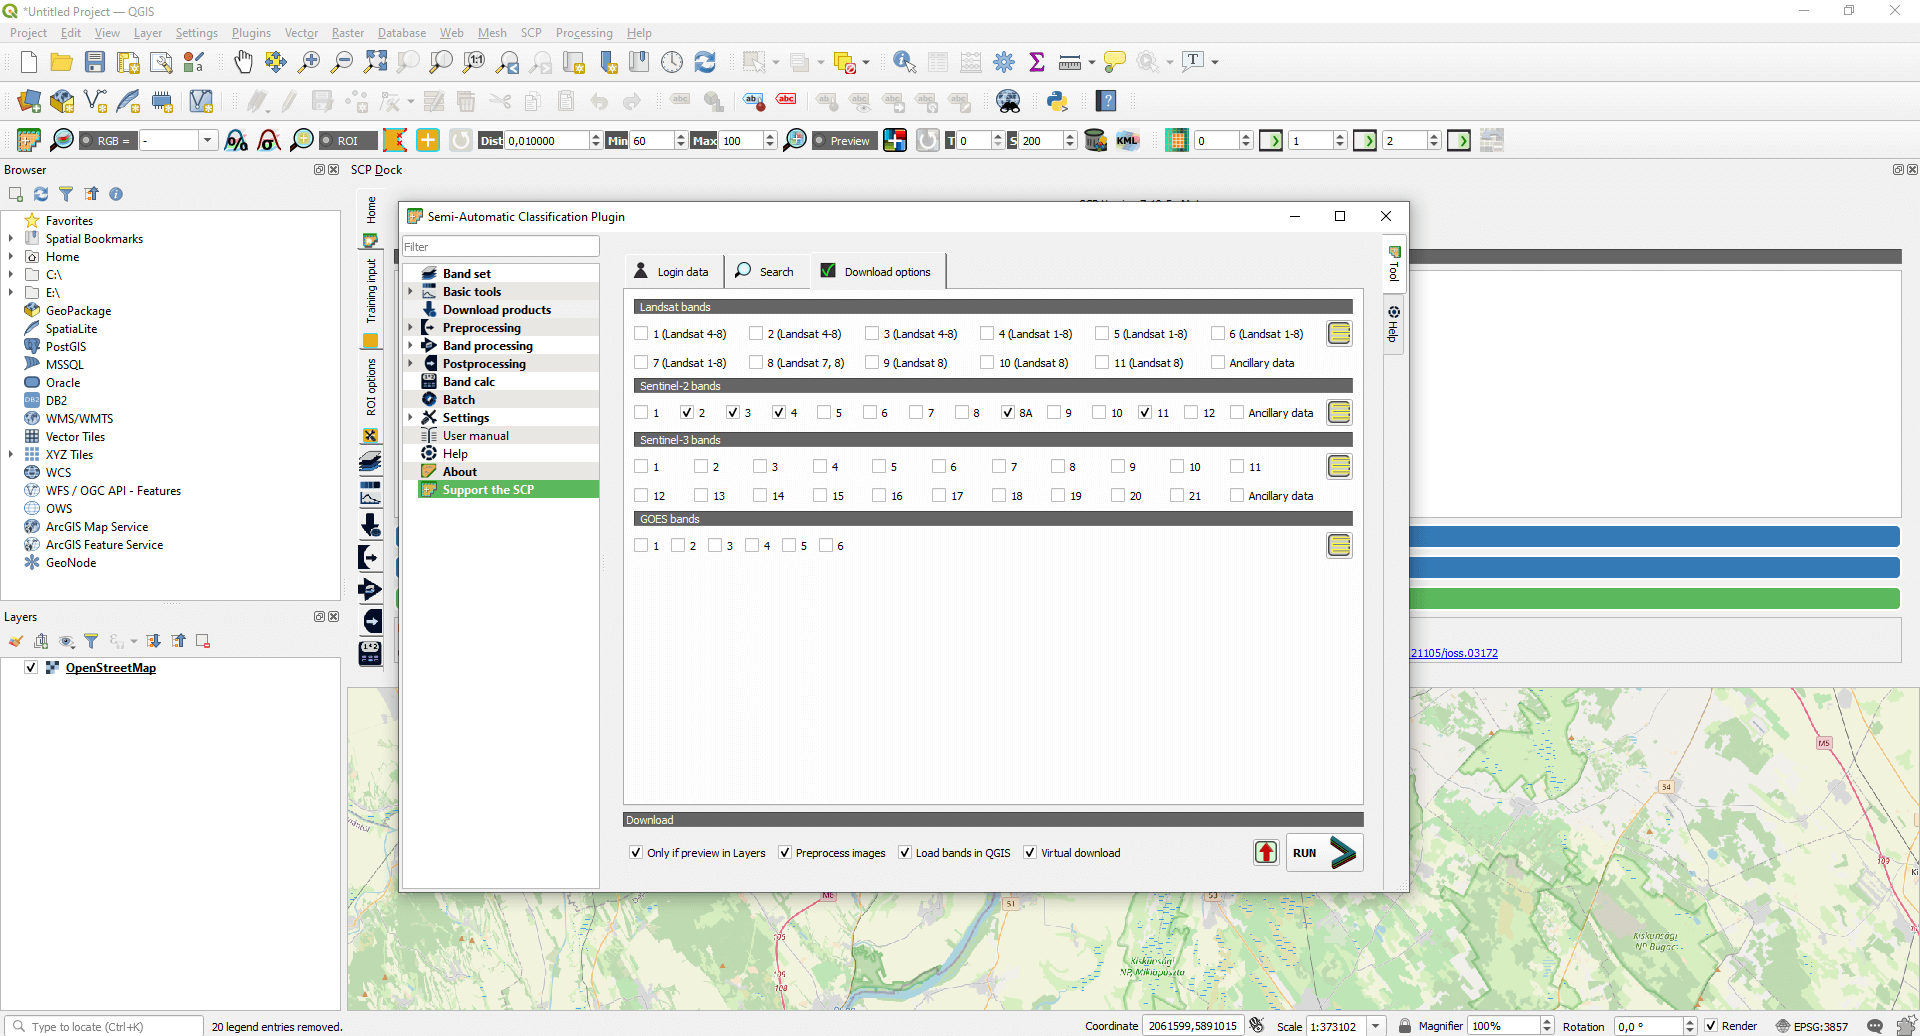
We won’t use all the Sentinel-2 bands so under the “Download options” tab pick the following: 2,3,4,8A,11.
Click on “Find images” (it has a small magnifying glass image). Now the download of images will start shortly.
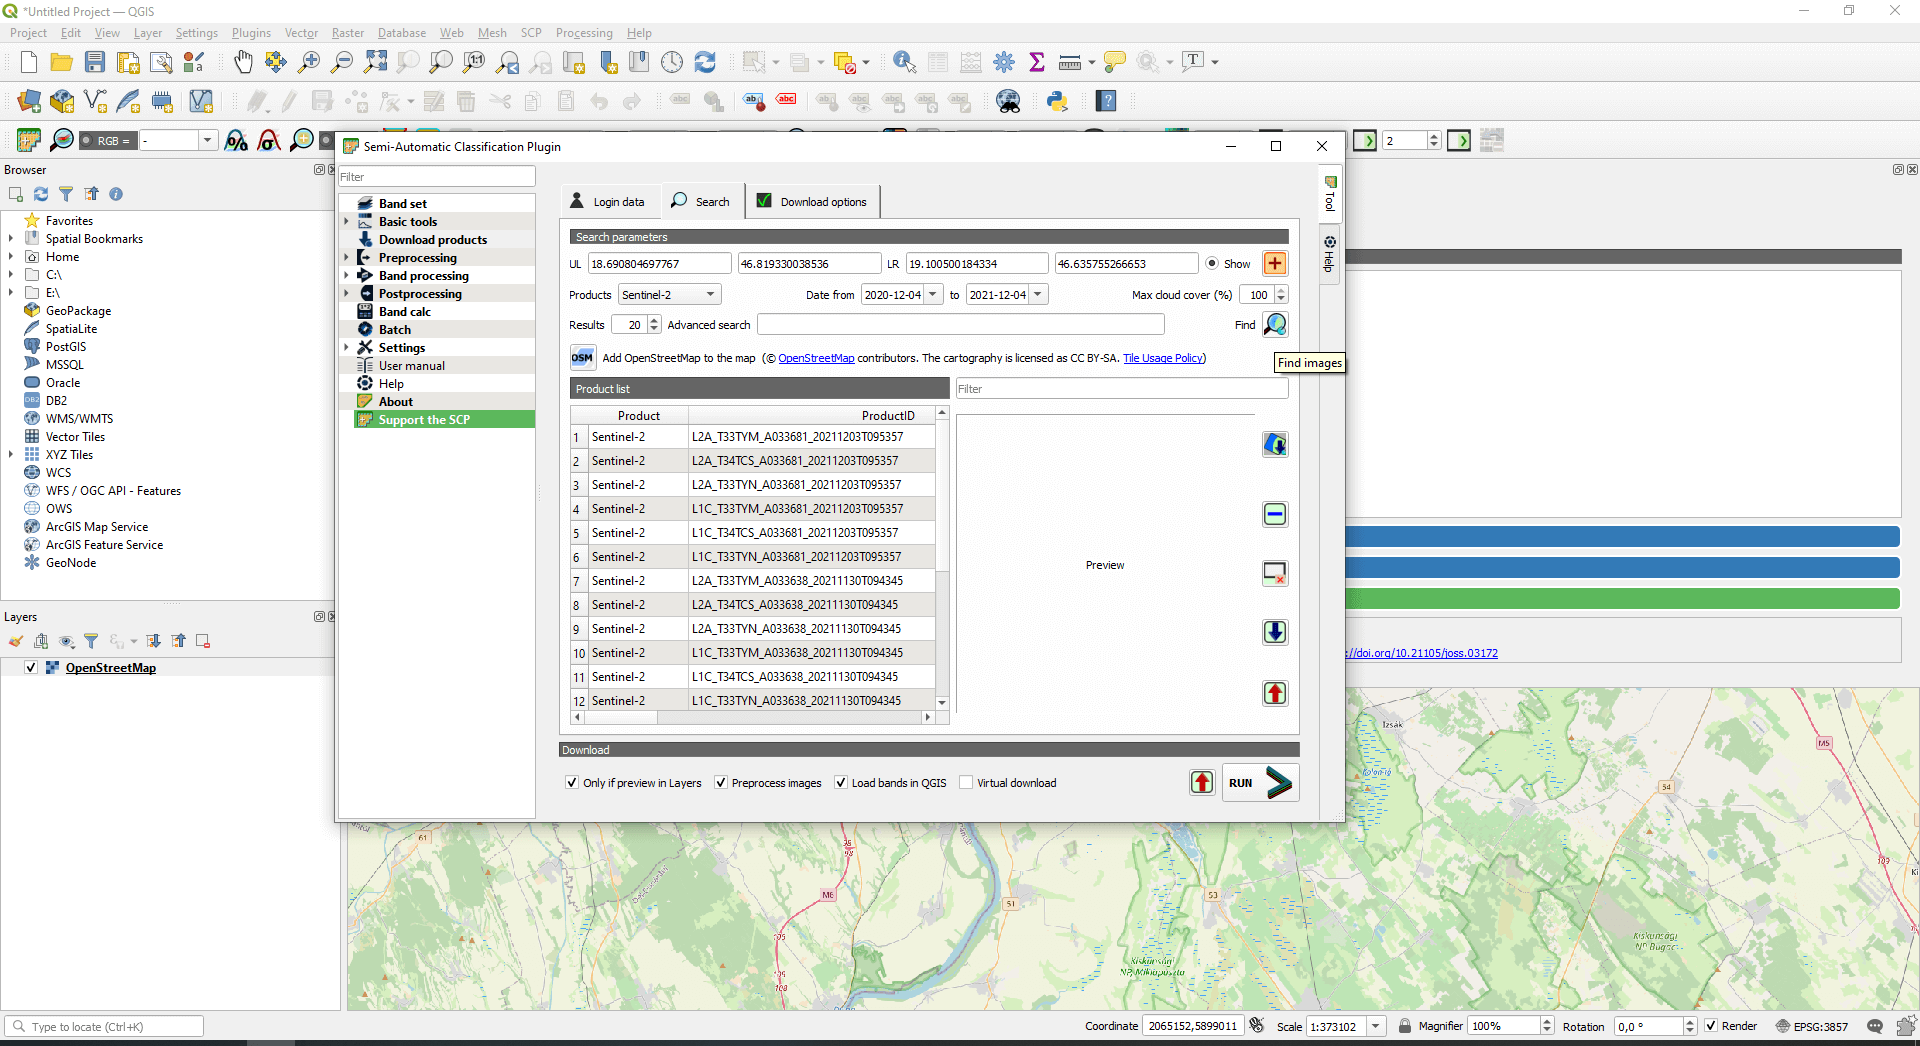
Select the image you want to examine and press “Display preview of highlighted images in the map”.
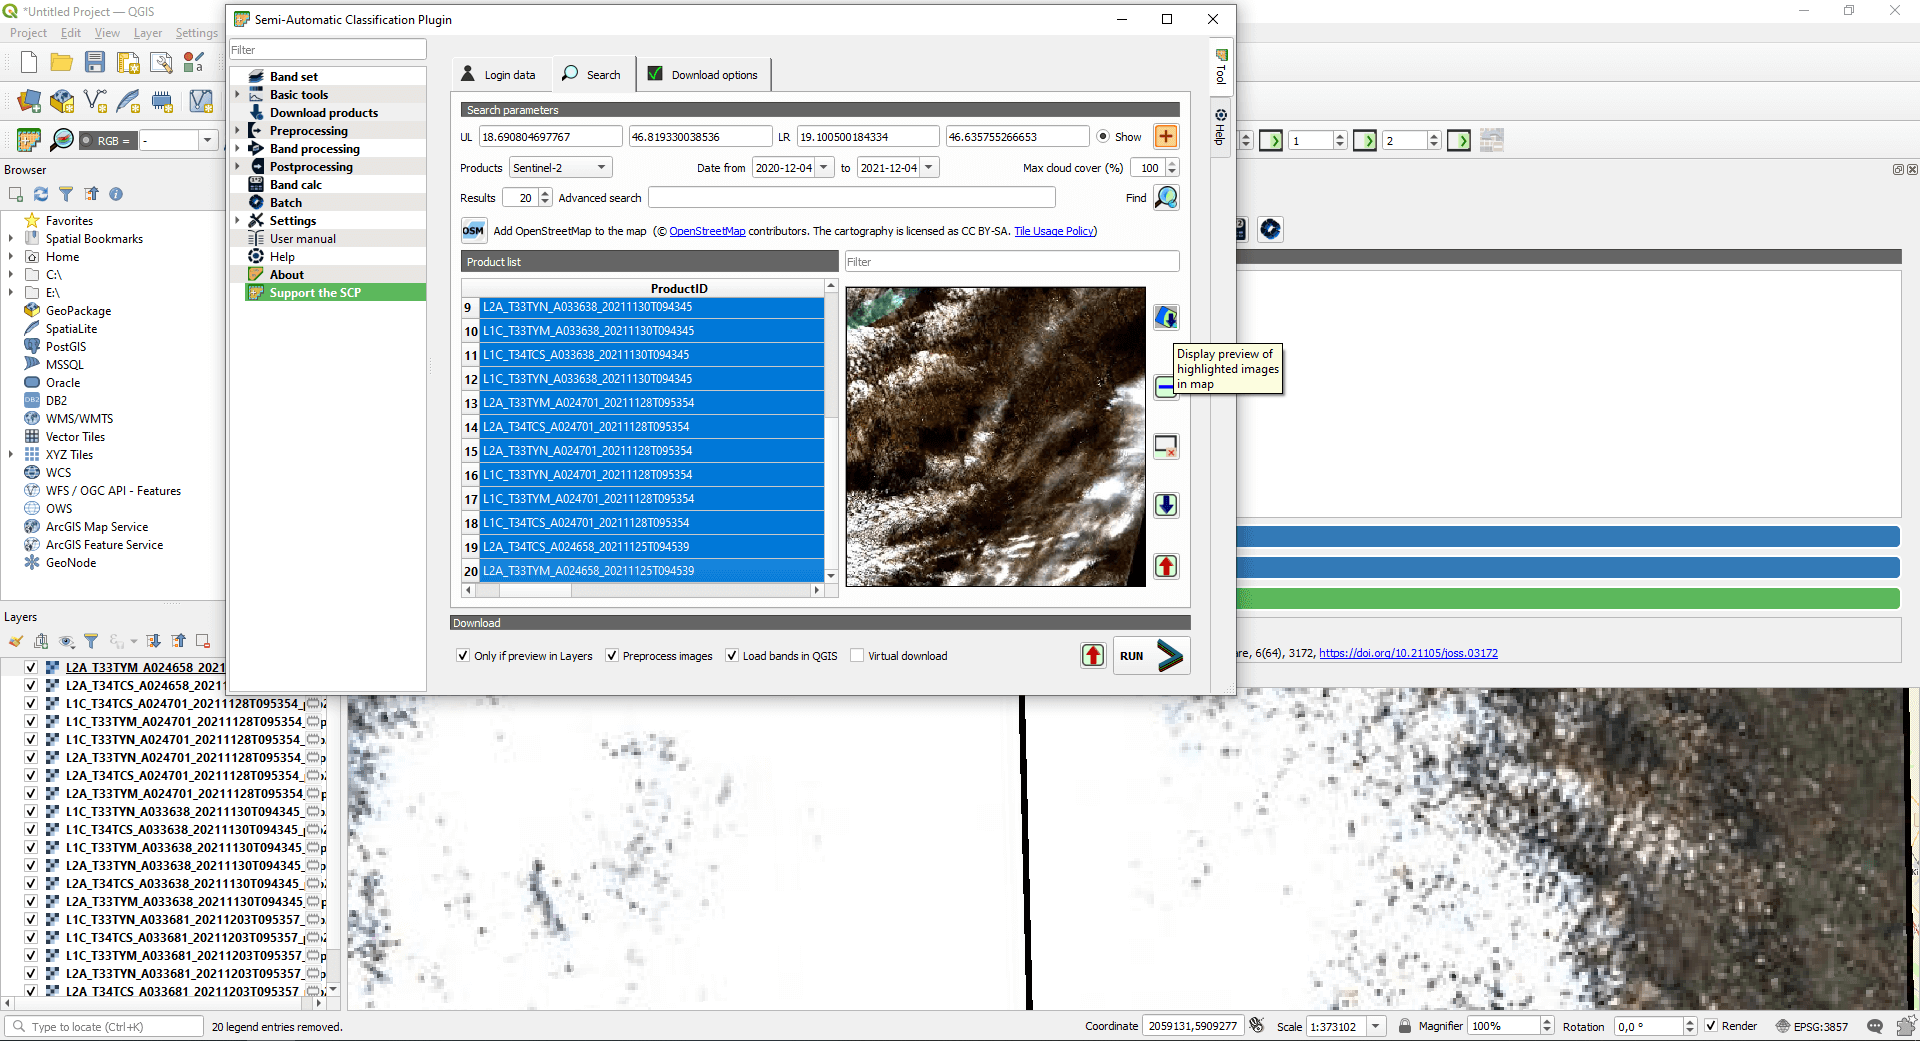
Press “RUN” in the bottom right corner and save the image in a separate folder. If you have selected multiple images, this can take a while.
Image analysis in QGIS
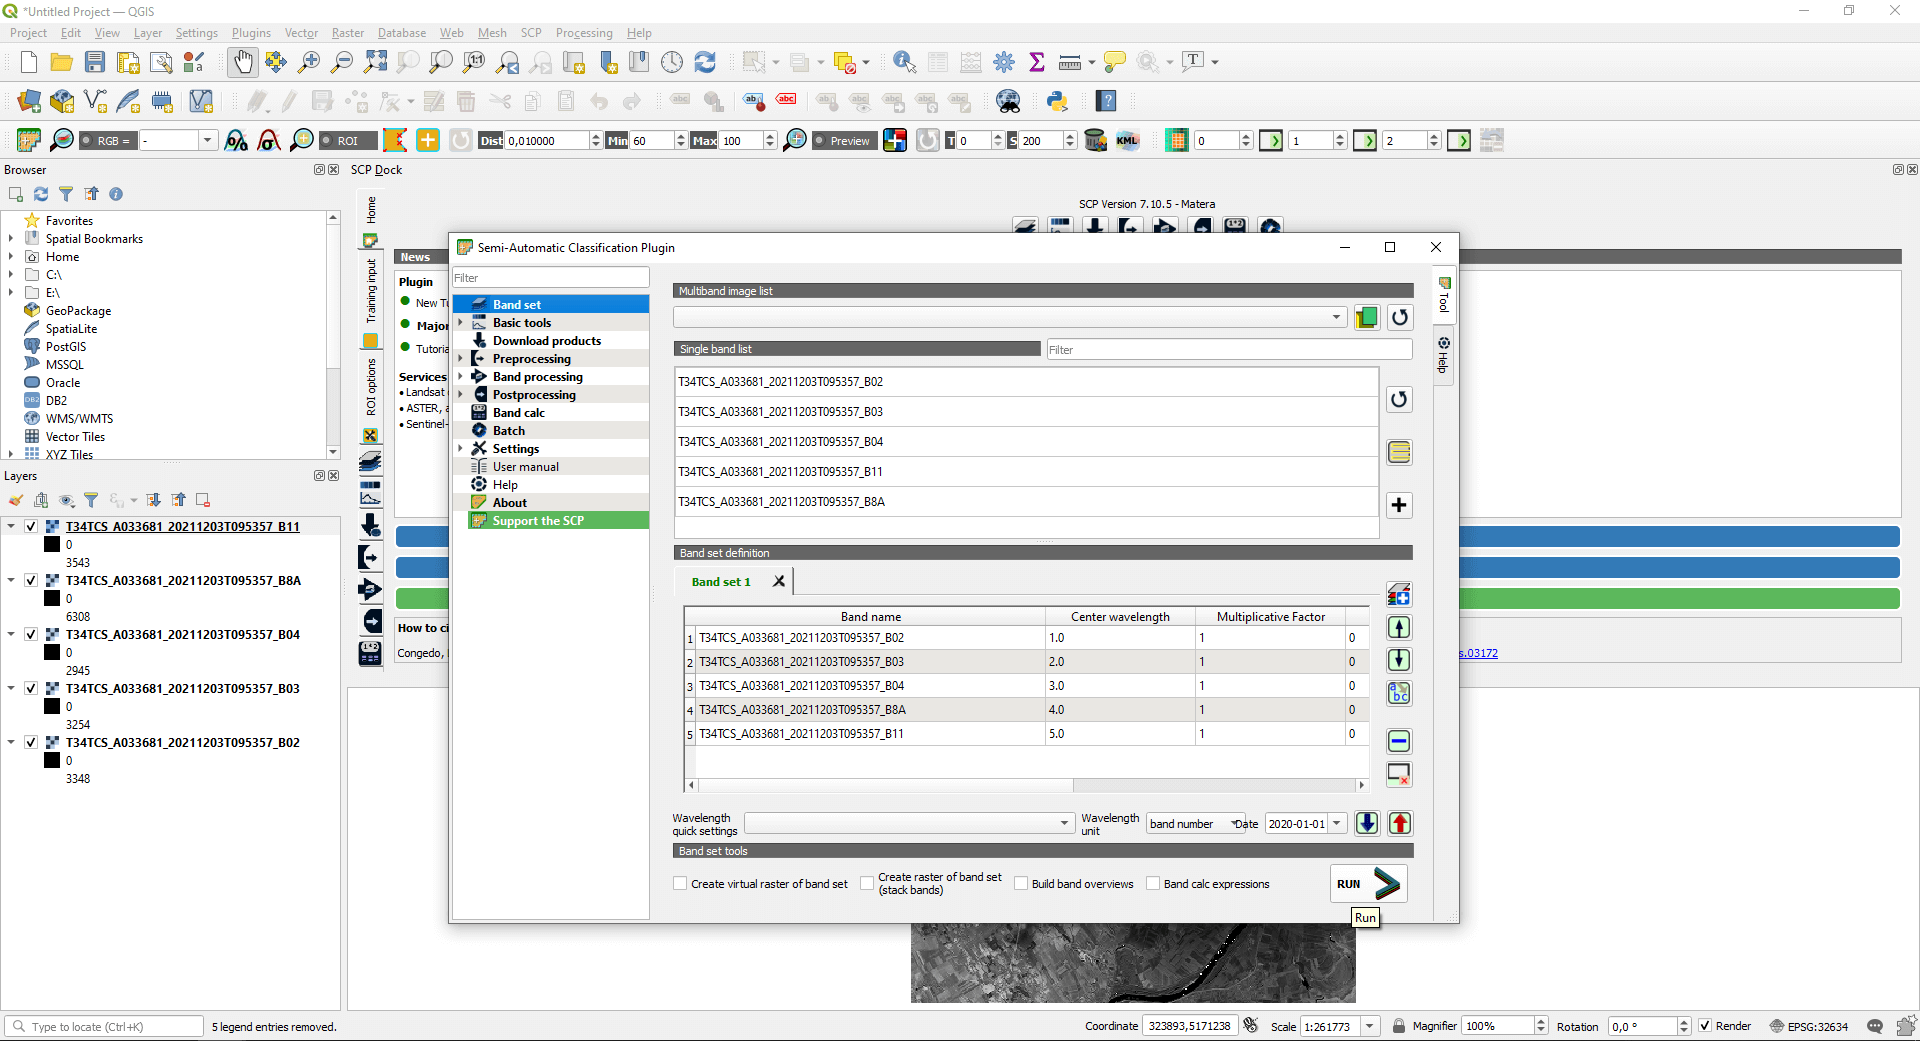
The image analysis of the downloaded raster files follows, where the analysis of the different channels (“Band”) is performed using a mathematical expression. Okay it won’t be as difficult as you think. At first, we go to the “Band set” menu, where we can open downloaded images with the “Open file” button.
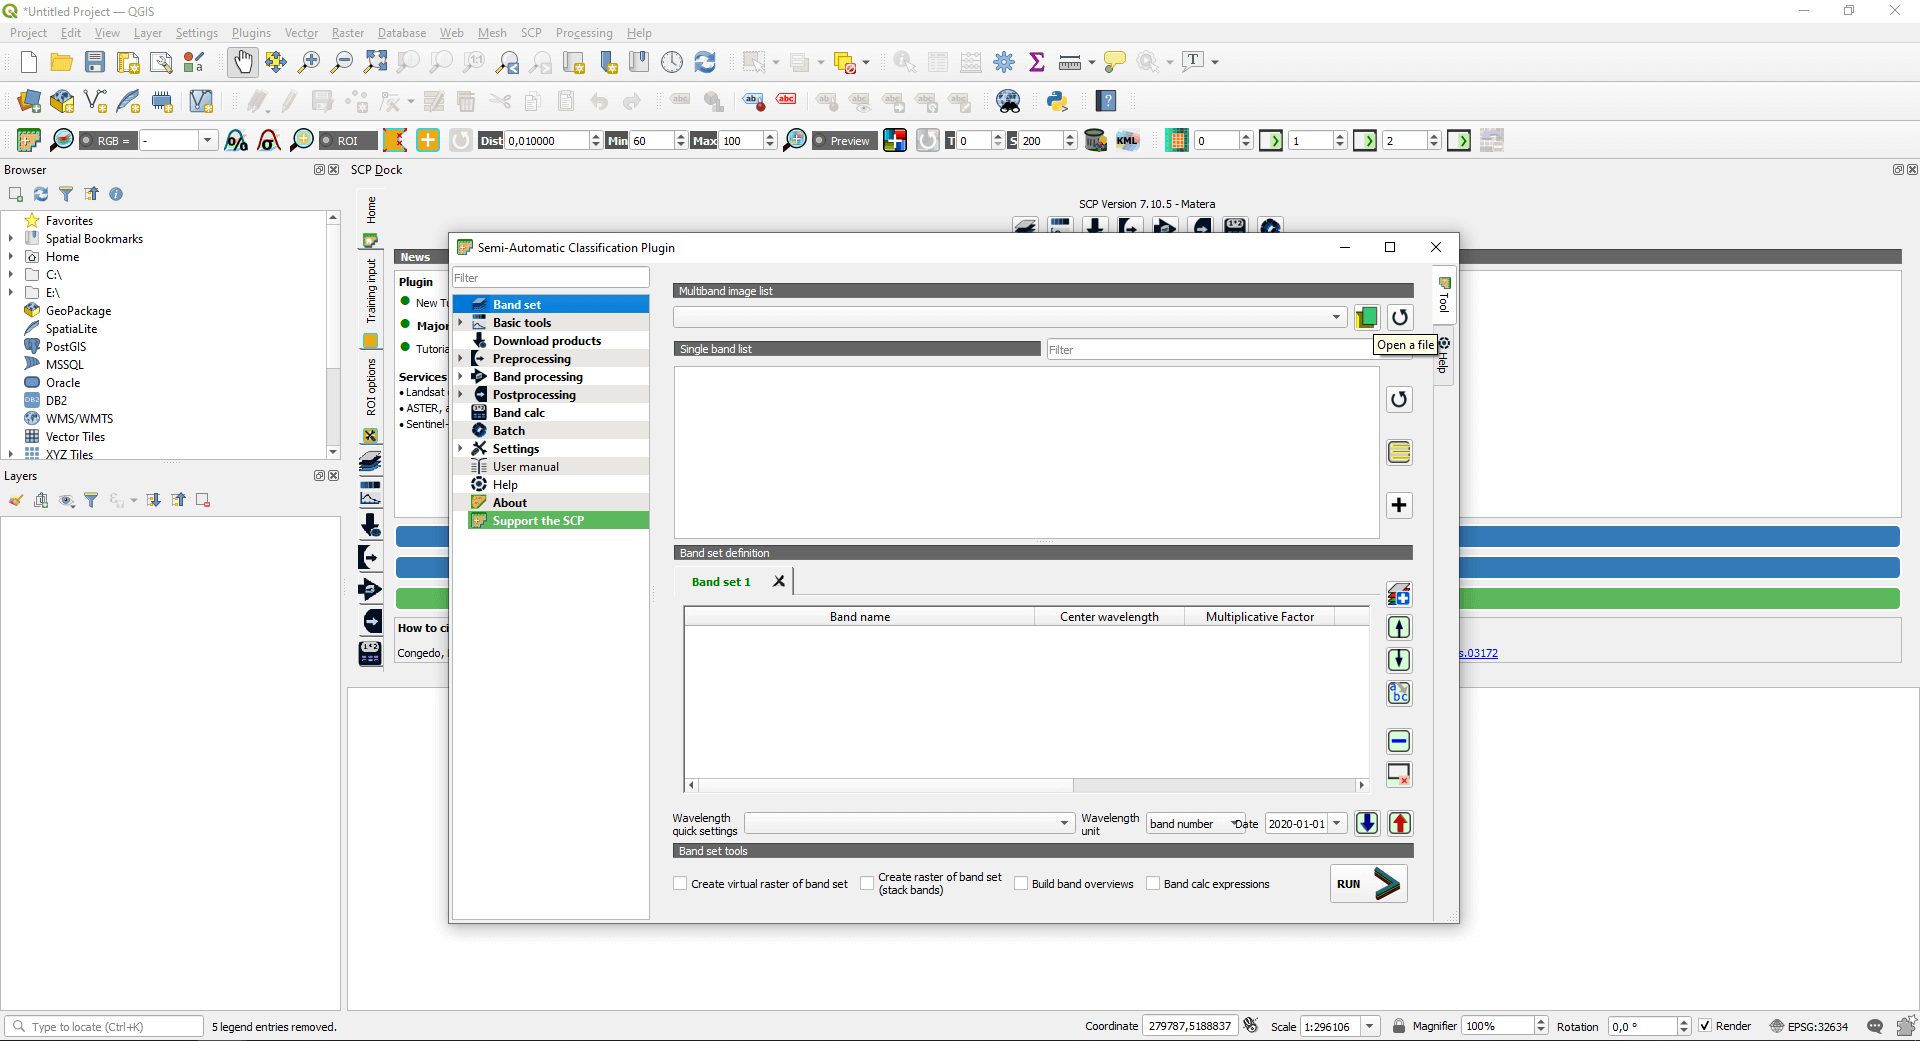
Then embed the images into a “Bandset” by pressing “RUN”.
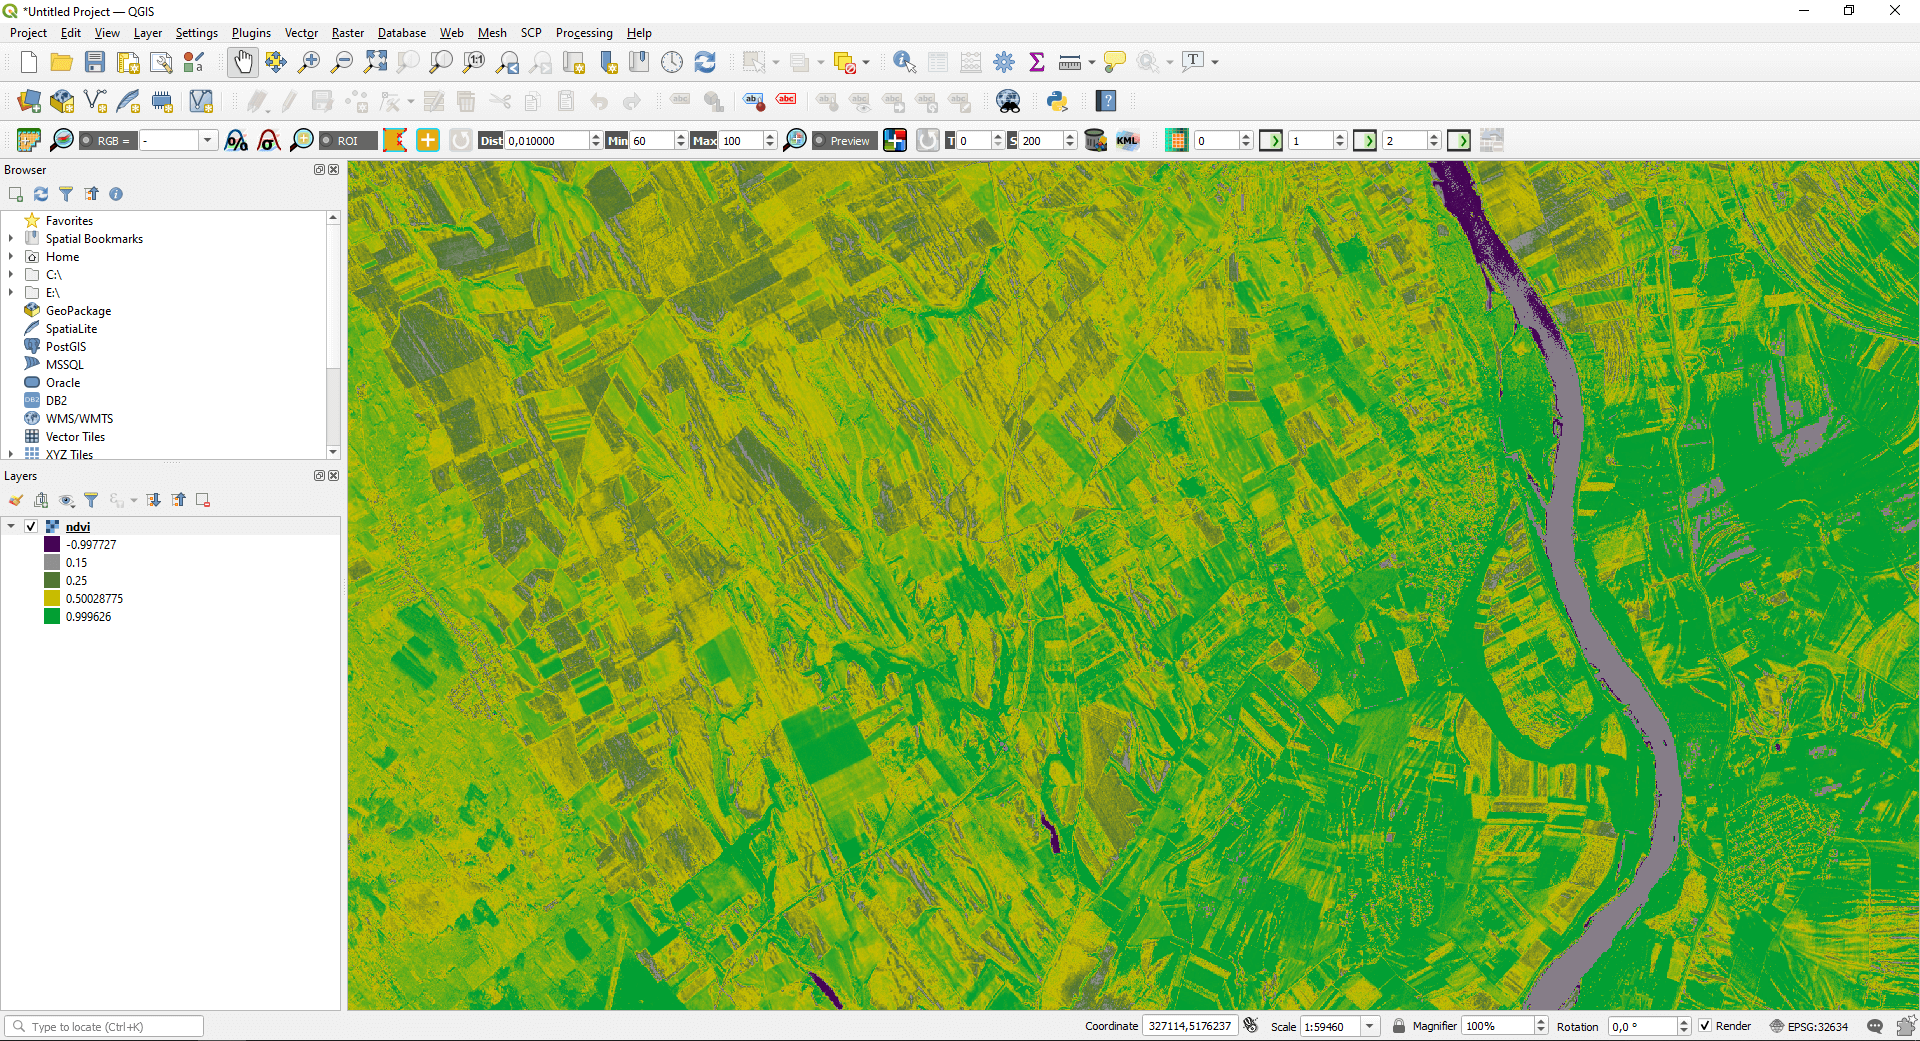
You can add NDVI and NDWI index calculation formulas under the “Band Calc” tab. Let’s start with the calculation of normalized difference vegetation index (NDVI):
("bandset#b4"- "bandset#b3")/("bandset#b4"+"bandset#b3")
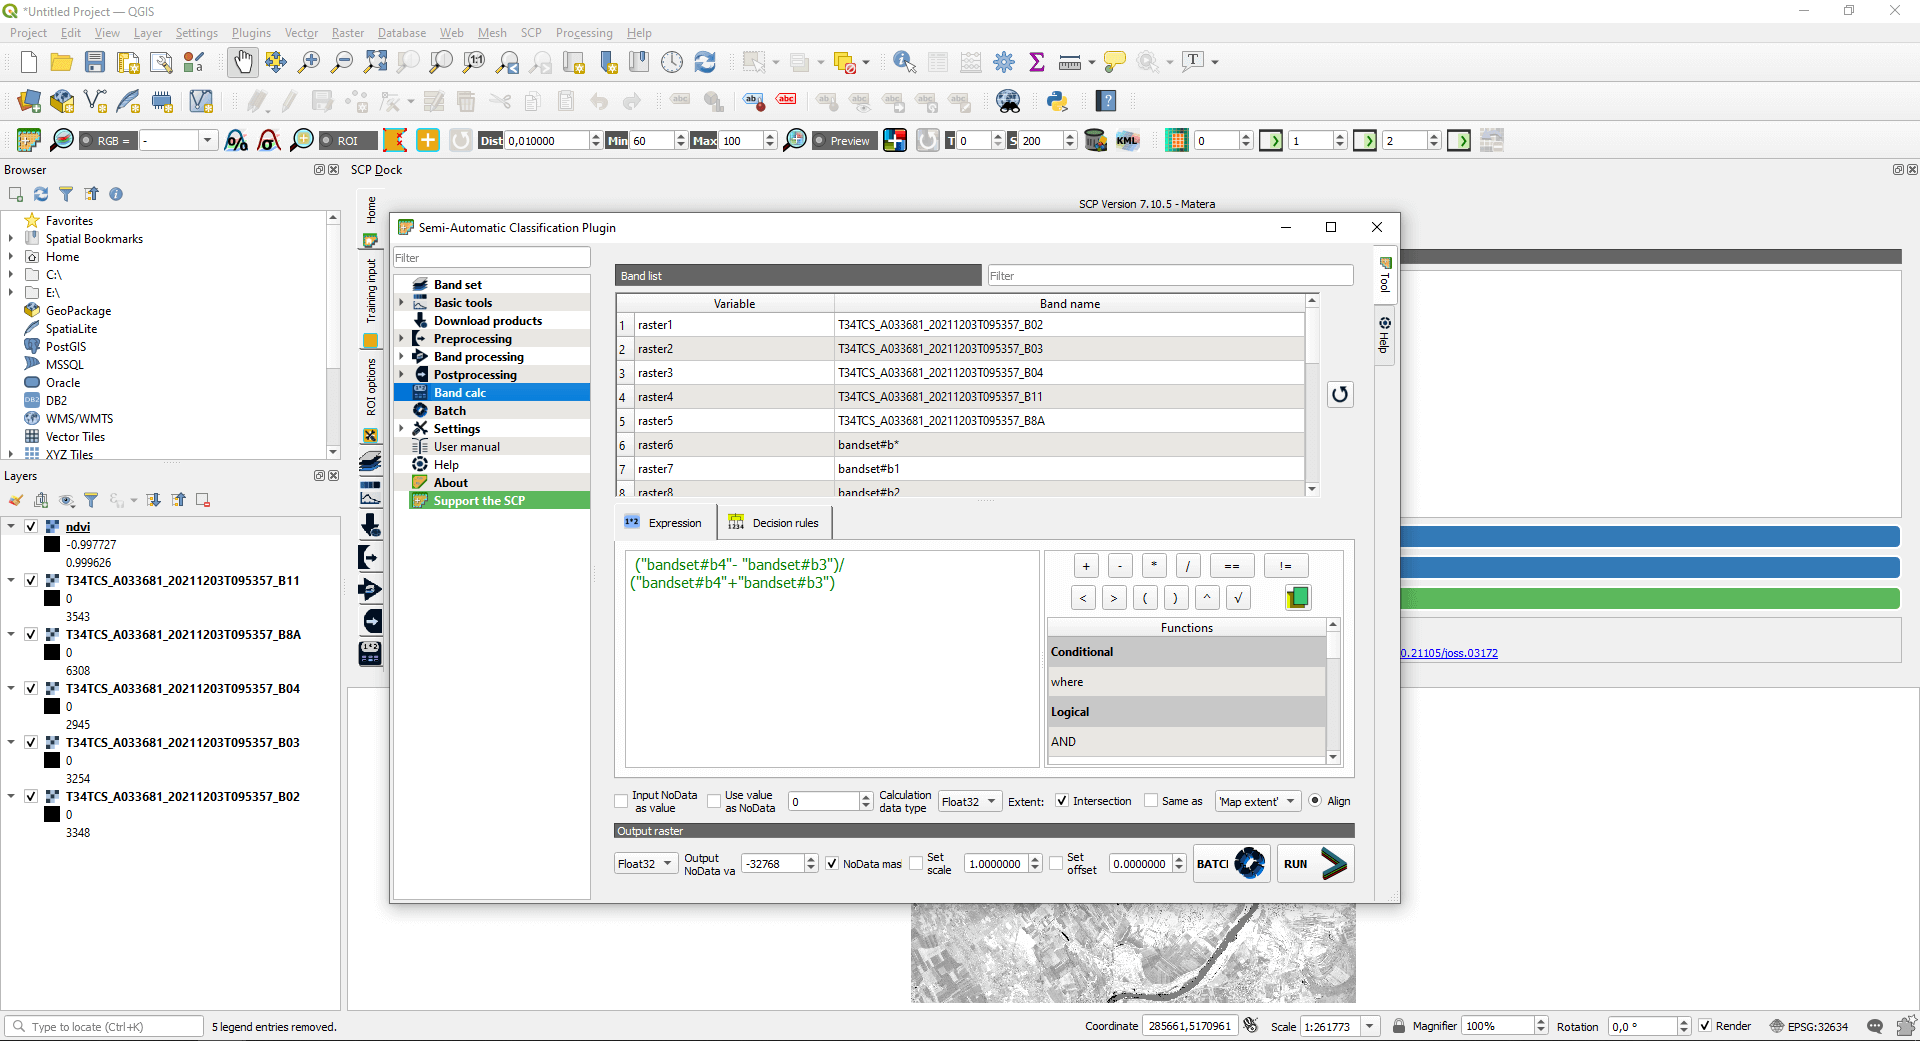
This covers the following formula: (Band8A-Band4)/(Band8A+Band4), where Band8A is a near-infrared range (NIR) and Band4 is a visible red range. If you adjust the color scale (as I’ve shown you before), you get a nice vegetation map.
Now we create normalized difference water index (NDWI) too:
("bandset#b4" - "bandset#b5")/("bandset#b4"+"bandset#b5")
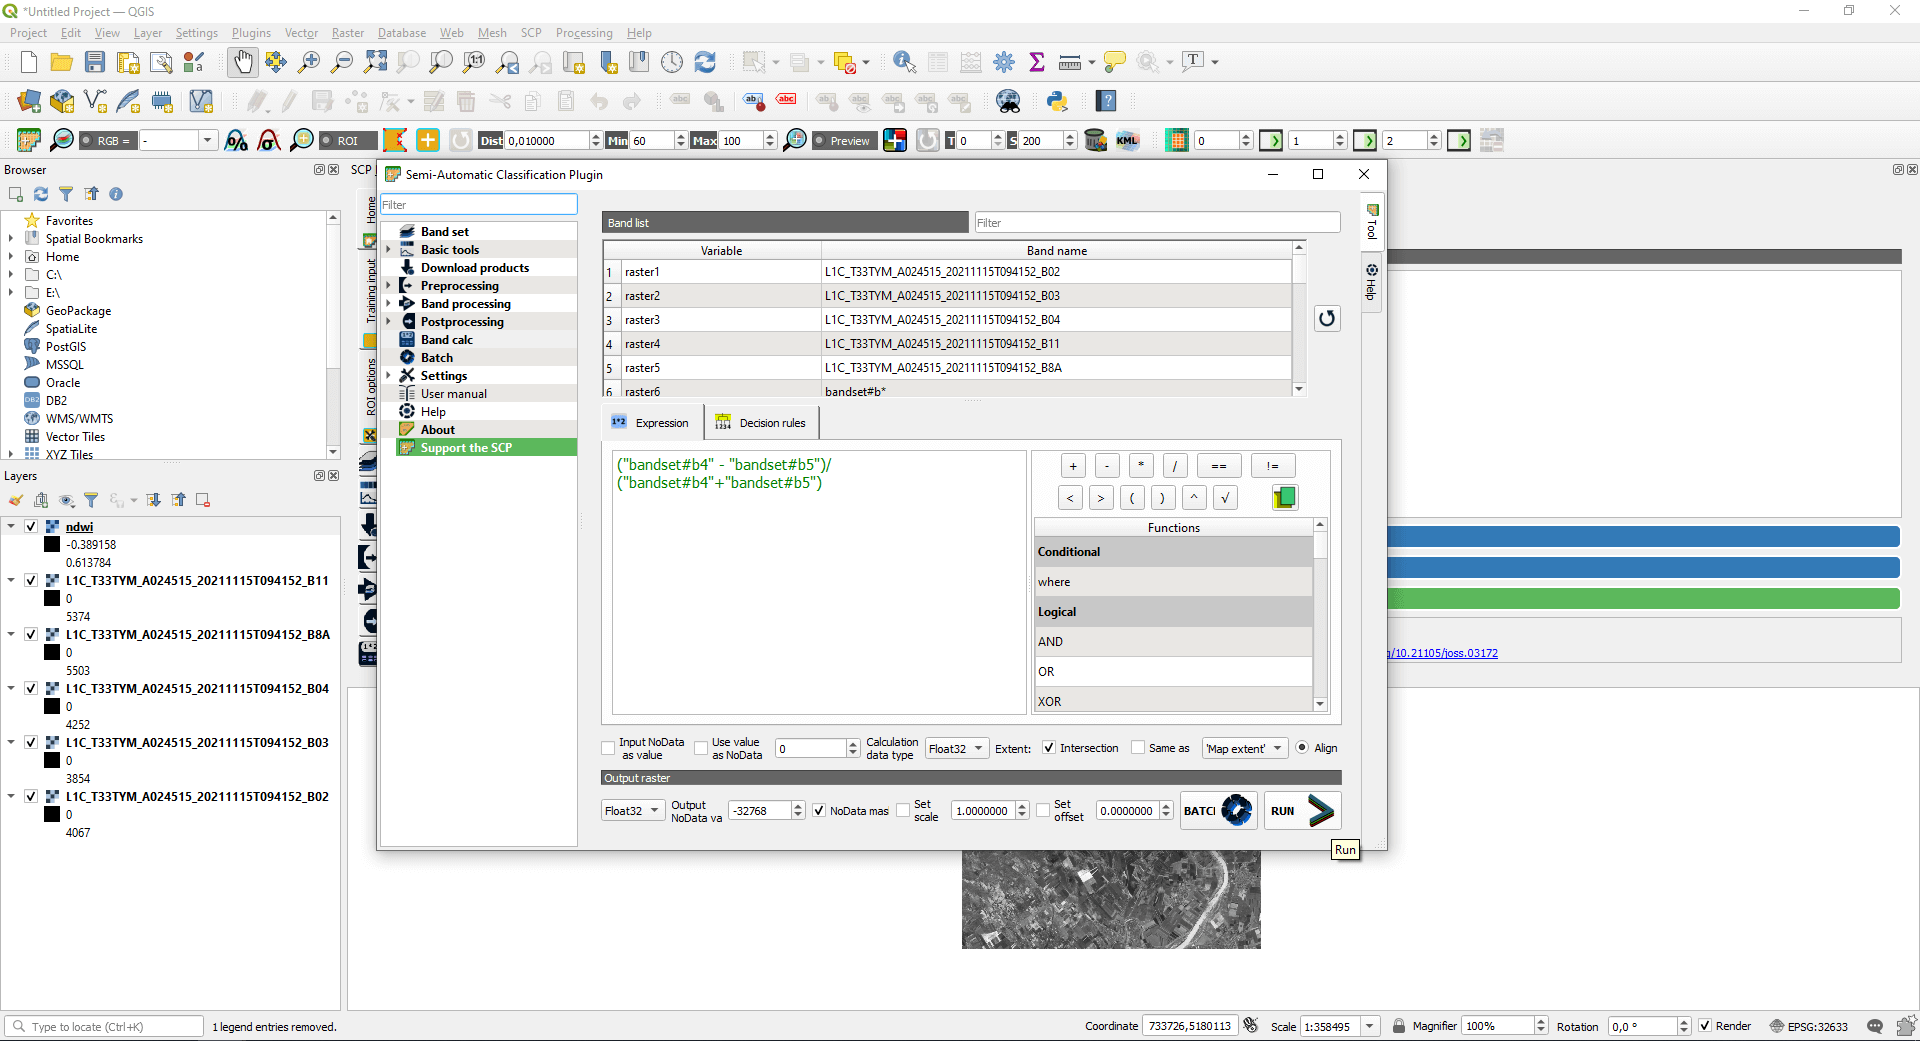
This covers the following formula: (Band8A-Band11)/(Band8A+Band11), where Band8A is the near-infrared range (NIR) and Band11 is the short-wave infrared (SWIR). The water index result map also well shows which areas are permanently or periodically water-covered.

Storage and web sharing of the results
Geospatial analyzes (including image analysis) can be special vector and raster files. Storing them properly and sharing them with others is a problem for most users. SurveyTransfer is the best solution to solve this problem, as it provides large storage space at a low price and extremely simple data sharing. Think of SurveyTransfer as the Google Drive of geospatial data!
Did you like what you read? Do you want to read similar ones?
If you really like what you just read, you can share it with your friends via our social media sites.