
The technique of GIS mapping and spatial data analysis is now widespread. More and more companies are dealing with spatial analysis for business purposes. The outputs of these techniques will be various GIS maps. With the rise of drone technology, GIS mapping and spatial data analysis gained even more momentum. The data produced by drone mappers can best be analysed in a GIS environment. This means that the orthophoto of the result of a drone mapping or a digital elevation model is only the starting dataset! Additional information can be extracted from these files through spatial analysis. From a DEM, for example, it is possible to analyse the surface that can be utilized in agriculture or even calculate the Visual Line of Sight. In order to have a good understanding of GIS mapping and spatial data analysis, this article starts from the basics, i.e. GIS data models.
What is GIS mapping and what is spatial data analysis?
GIS refers to the assignment of the science of information technology to a geographic location. It was developed for the observation, modeling, mapping, and analysis of phenomena existing in the geographical space. Geospatial mapping provides an opportunity for a quick, combined, integrated review and analysis of a large number of spatial and descriptive data. In summary, GIS means the application of a computer system that can be used to collect, store, manage and analyse spatial data and display derived information.
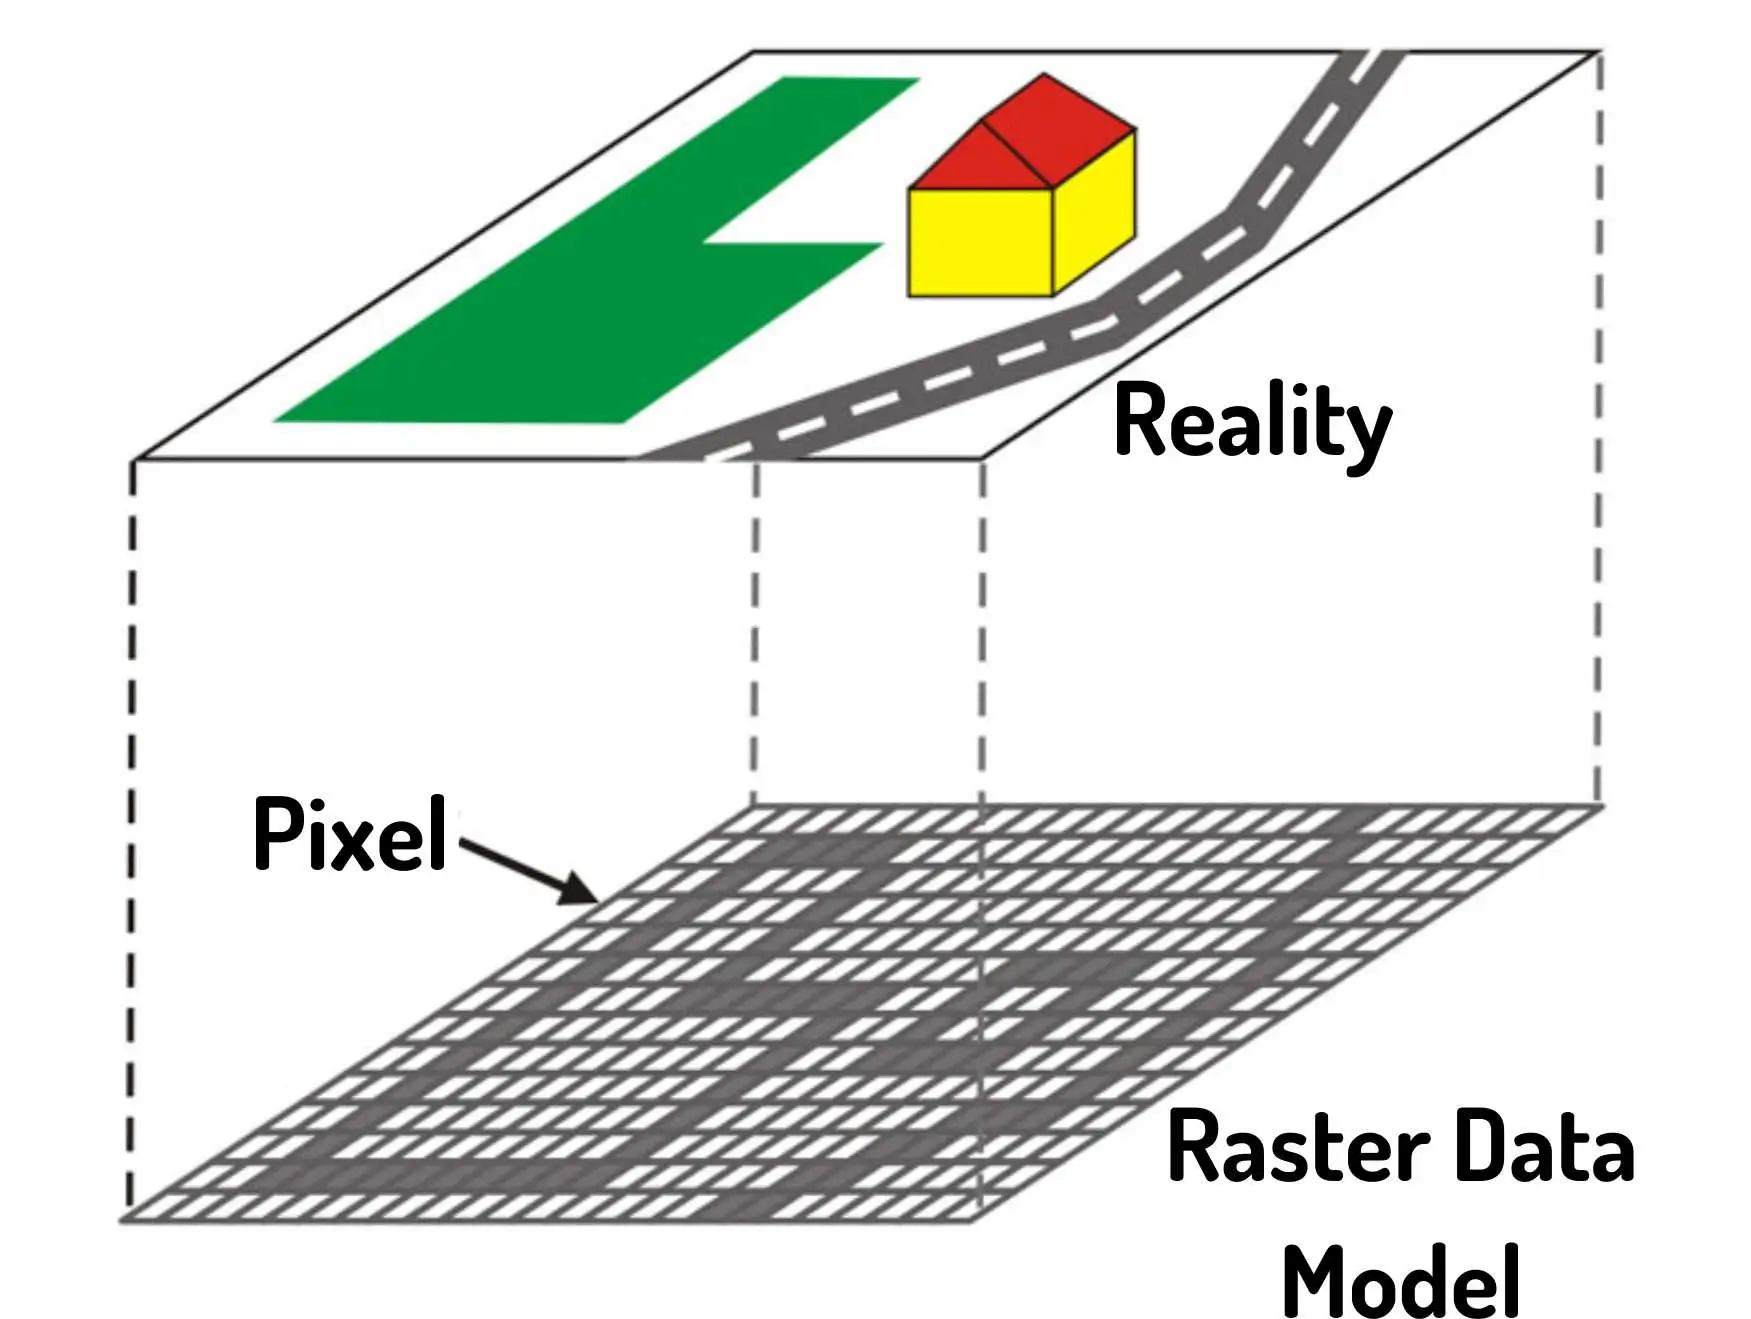
Raster data in GIS mapping and spatial data analysis
The smallest element of the raster data model is called pixel, which comes from “picture element”. Pixels can be triangles, squares, or hexagons. During GIS mapping, we have to imagine a raster file by covering the selected area with a grid. In other words, during the spatial data analysis, the examined area is covered in a mosaic fashion with a raster model. A landmark can consist of several smaller pixels, these pixels are distinguished from the pixels in their surroundings by color codes and other properties (e.g. height values). This data model can be considered primarily as a GIS format for aerial and satellite images. Actual examples of raster data models: orthophoto mosaics, digital elevation models (DEM), scanned maps.
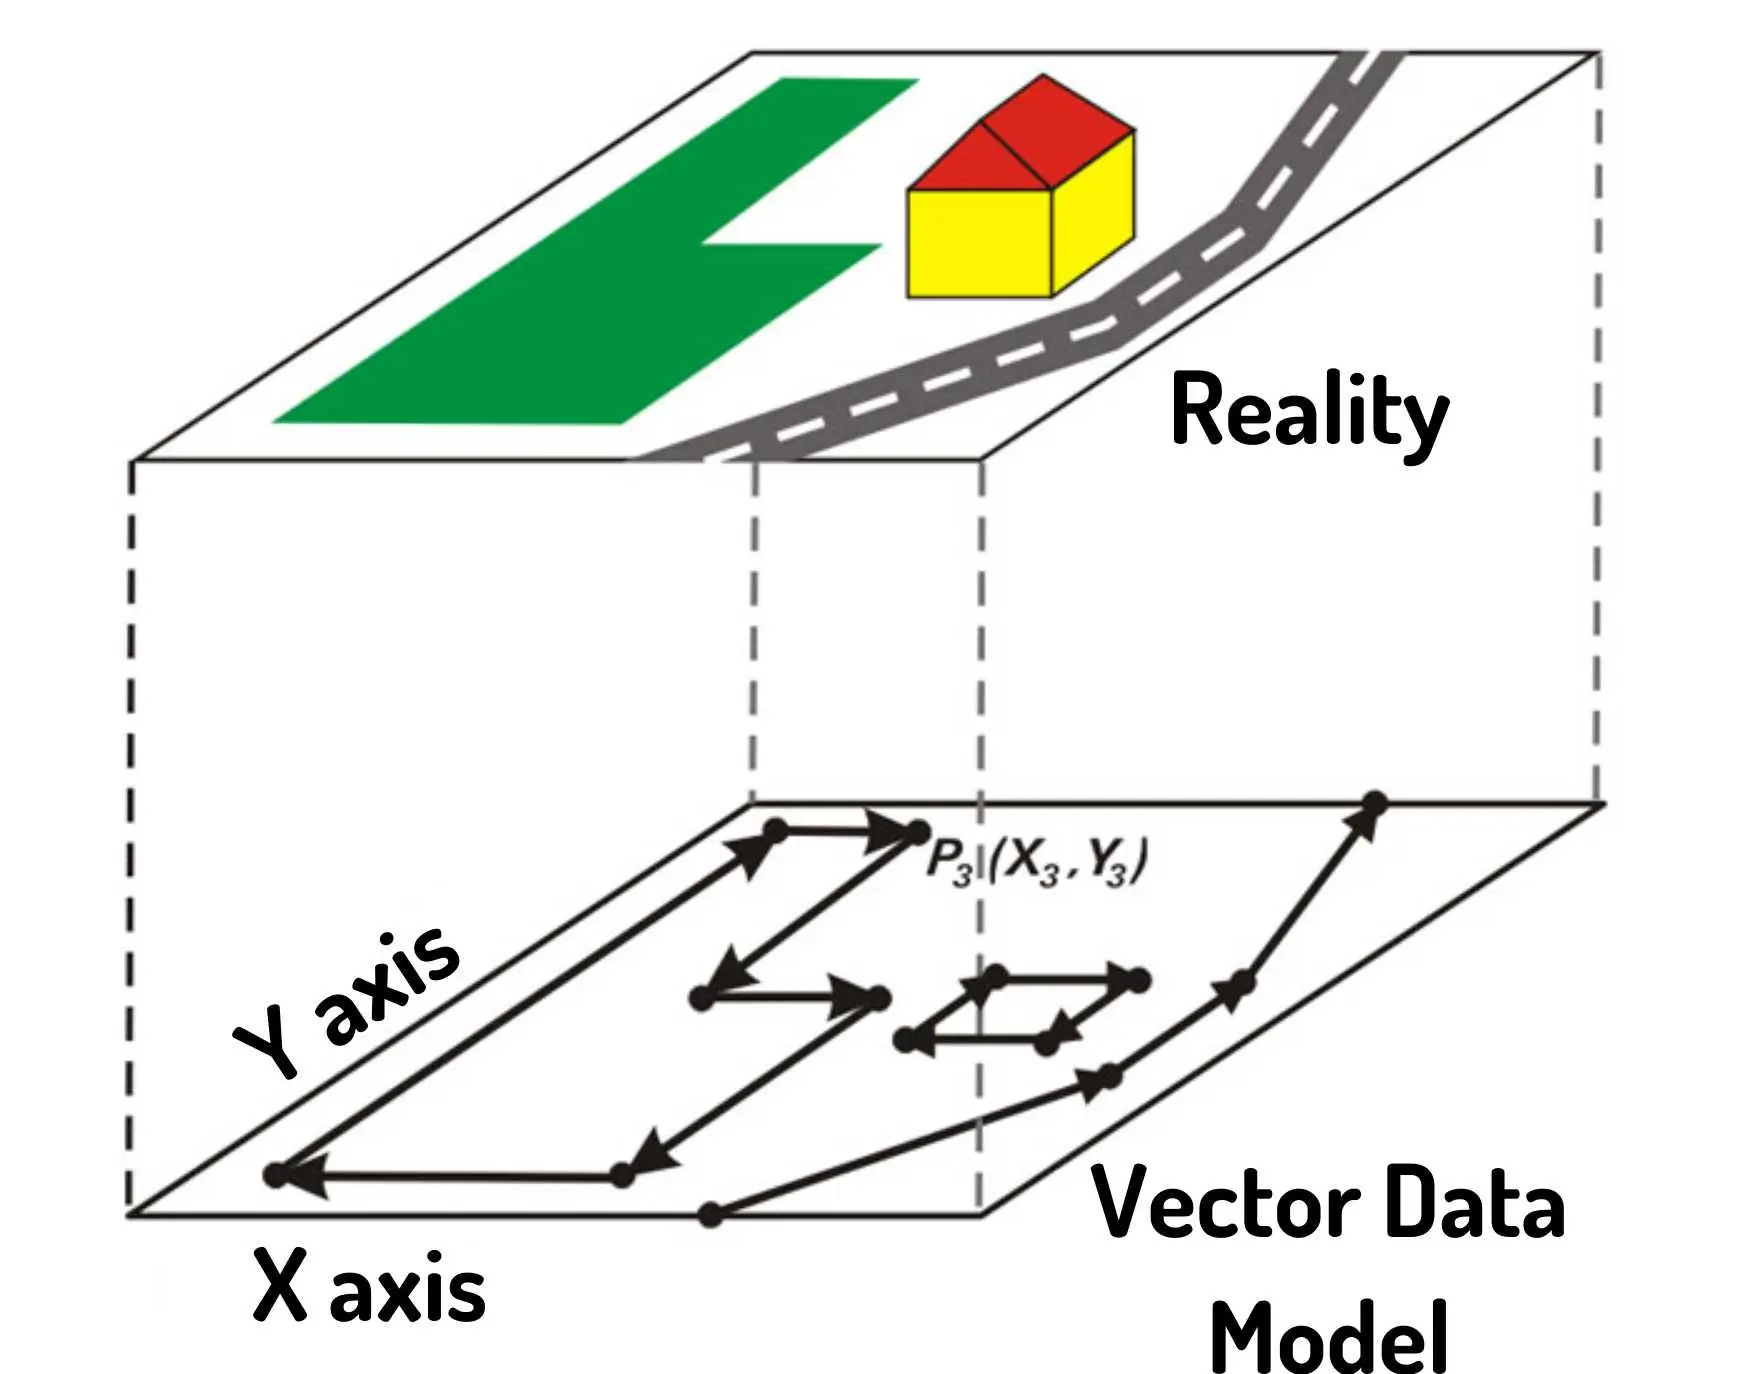
Vector data in GIS mapping and spatial data analysis
The essence of the vector data model is that the points, lines, and surfaces produced during GIS mapping are described with the coordinates of breakpoints. At the same time, it is necessary to specify the direction or order in which these points are to be connected. Starting from this, we can go from simple geometric shapes (points) to more complex objects (polygons) and detailed descriptions of their relationships to each other. The vector data model also provides descriptive data during spatial analyses, as properties (attributes) can be assigned to each object. These attributes can be numbers, text, dates, and other data types that can be organized into columns. Compared to rasters, vectors are easier to organize into spatial databases. In GIS mapping, a vector data can be a polyline of a high-voltage line, the floor plan of a house or a well (if it’s marked as a single point).
The new data of GIS mapping and analysis
More recently, point clouds and 3D models have been used in GIS mapping and spatial data analysis. If we really want to explain it, the point cloud can ultimately be classified as a vector data model. Textured 3D models, on the other hand, use both raster (texture) and vector graphics (mesh). Since 3D GIS mapping is in its renaissance, it is essential to talk about these 3D files as well. Classic vector and raster data models are not fully suitable for 3D spatial analysis and visualization, so GIS programs are increasingly opening up to point clouds and 3D models.
Base cases of spatial data analysis through GIS mapping
In a spatial analysis, the two classic data models are usually used together. The maps produced during the analysis and GIS mapping are not ordinary topographical maps, but models suitable for answering specific spatial questions. Such questions may include:
- Where are those places that…?
- What happens if…?
- What state prevailed at this moment in time?
Two types of spatial data analysis can be distinguished: analysis of geometric data and attribute data.
Geometry level spatial data analysis
During the analysis of geometric data, we can examine the shape of objects and their interactions and spatial relationships. Buffer, clip, intersect, union, proximity or road network analysis performed in the case of vector data are considered such spatial data analysis. In the case of raster GIS data, we can think of a volume calculation, determining the intersection of different raster data or resampling. In addition to all this, more specialized GIS data analyses can also be performed, such as the conversion of raster and vector data models into one another.
Spatial data analysis based on attribute and professional data
When analysing the attribute data, we examine the data behind the geometry, which can be used to filter, combine, and modify new GIS maps. During a geospatial mapping, the vector data can be filtered and sorted using SQL, thus even new thematic maps can be produced. The rasters also store attribute data, since a slope map contains the values of the slope, while a height model contains the data of the terrain level. In case of raster data, spatial analysis can be performed on the data hidden in the pixels with the raster calculator.
Storing and sharing the results of GIS mapping and spatial data analysis
GIS mapping and data analysis can generate large files in special formats. Storing them, displaying them on the web, and handing them over to clients or colleagues is a serious challenge. SurveyTransfer is a data sharer specialized for this task, which means fast and simple storage, representation and sharing of large maps and 3D files. It is also a collaboration interface where all participants of the GIS project can work together for success!
If you really liked what you read, you can share it with your friends. 🙂
Did you like what you read? Do you want to read similar ones?