
Drone survey and agriculture plus GIS. These three are completely different fields that require vast knowledge in completely different technologies. Yet what do they have in common? The answer is spatiality. The common section gives the classic division: data collection, processing, display.
We can collect data from the target area with a drone (e.g., photogrammetry, LiDAR technologies). By processing this data, we can create a 2.5D digital elevation model (DEM). These files can be analyzed in a GIS software based on their location to calculate the proportion of a given area for a plant variety to be grown. So this can be a common intersection of drone survey and agriculture and GIS.
In our example, we are looking for suitable areas in the northern hemisphere for viticulture. We do this not only because we love quality wines, but also because spatial calculations can be well illustrated in this example. We search for slopes with southeastern, southern, and southwestern exposures that don’t slope above 11,3°. Apart from geometry, other natural endowments are also important, however, we won’t discuss them in this article.
In this article the process of the drone survey is not covered in detail. I assume that you’ve created a nice DEM with high resolution. We work with that in the following. For GIS processing you’ll need the QGIS software.
DRONE Survey, DEM ASPECT MAP and Agriculture
The equatorial orientation of the vineyards is crucial for the operation of the plantation. The equatorial exposure of hillsides influences heat and light conditions. This is favorable especially at the beginning and the end of the breeding. In Hungary, the southern, southwestern, and southeastern slopes are favorable for viticulture.
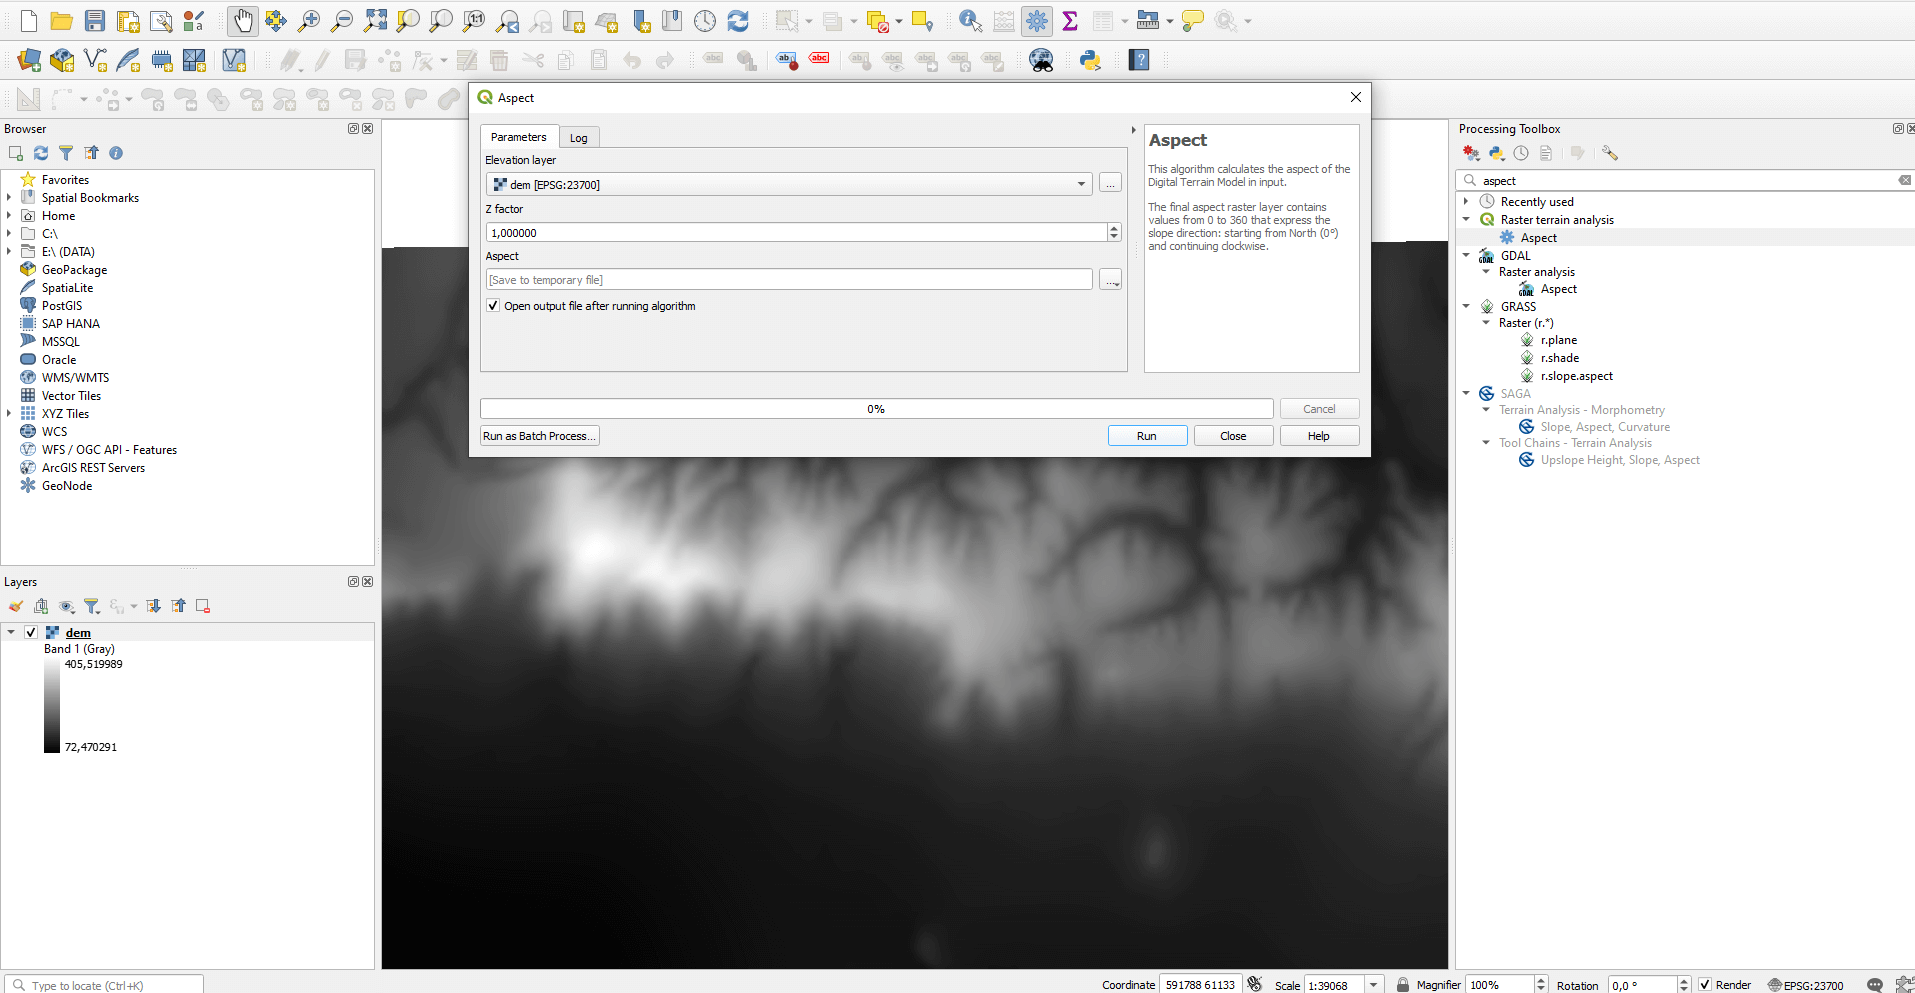
Based on this, let’s sort the previously listed slopes with QGIS. Start QGIS and open the DEM. Type “Aspect” into the processing toolbox, then run the function, similarly to the example below.
Now what exactly do you have to see on this strange map? To help you better understand this, I’ve created an illustration which shows the equatorial regions and their associated bearing angles. On the aspect map the 0° (and the 360°) shows the North direction. From this point, the values increase clockwise. We will filter by the values marked with green, because this designates the southeast, south, and southwest slopes.
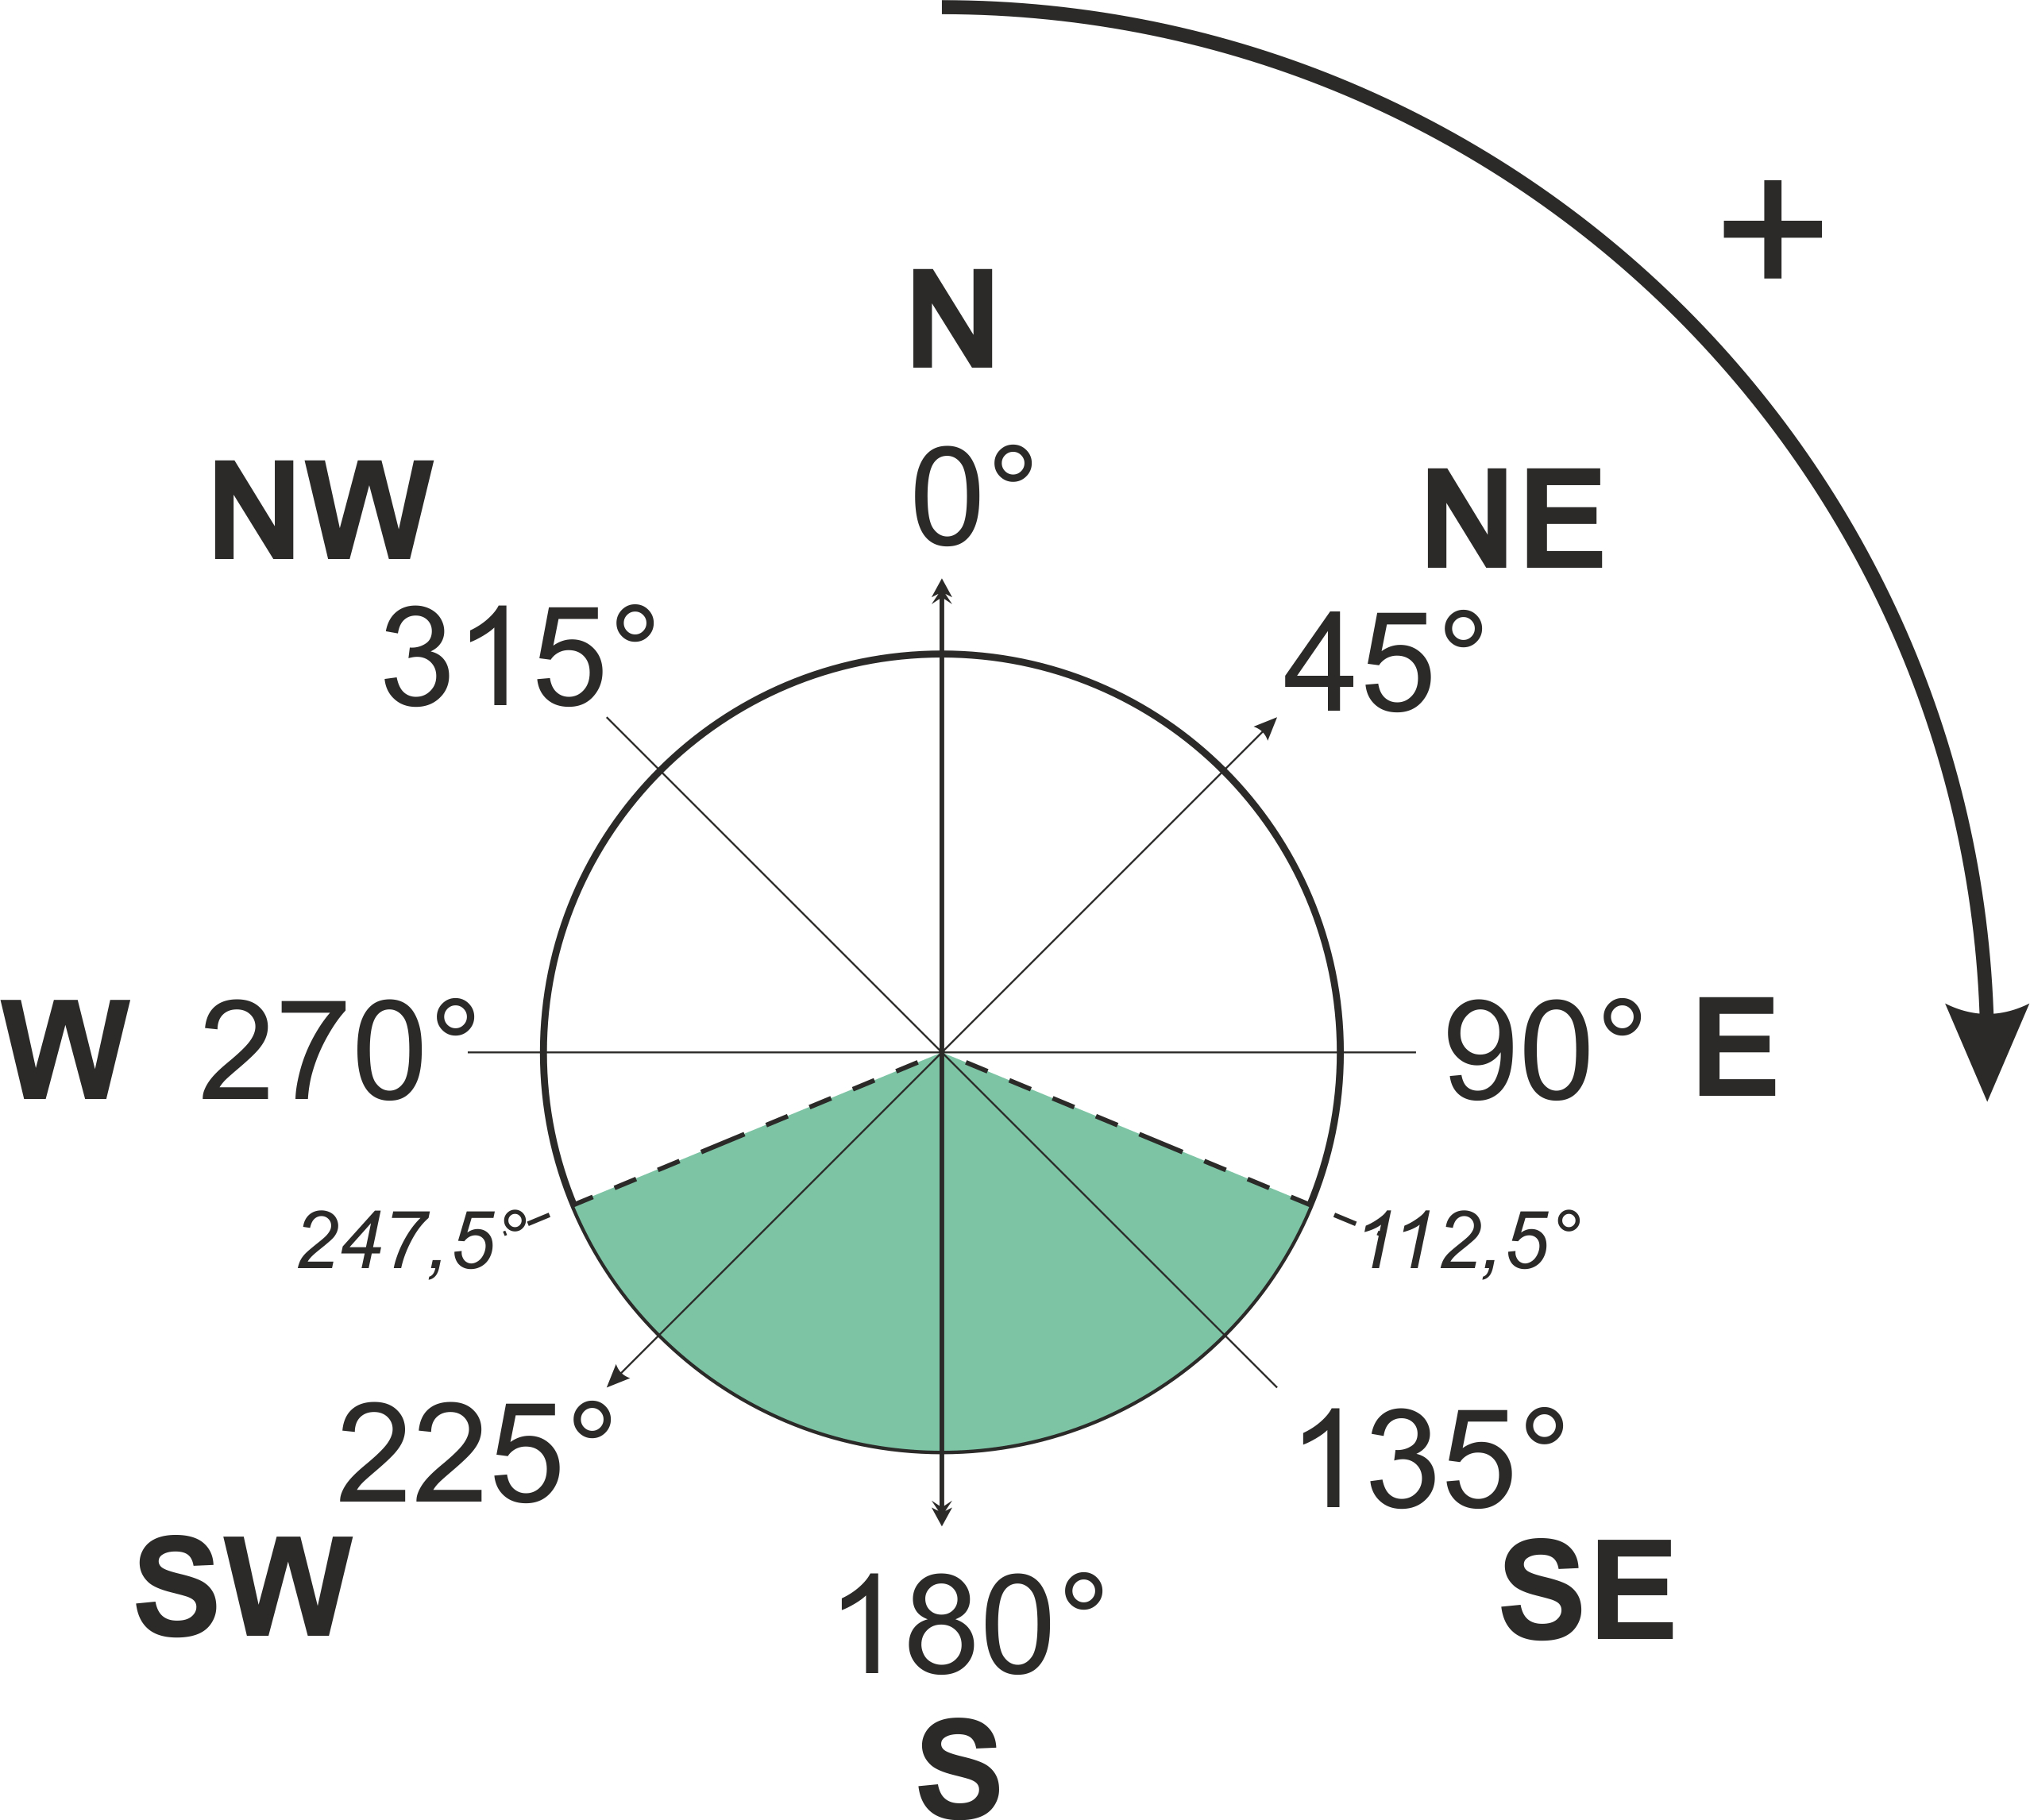
Sidenote: Some GIS software (like GRASS GIS) takes the East as the reference point for 0°. Therefore, the exposure should be interpreted in the consciousness of this. From this point, the values increase counterclockwise. That’s why it’s important to always pay attention to how the GIS software you use counts.
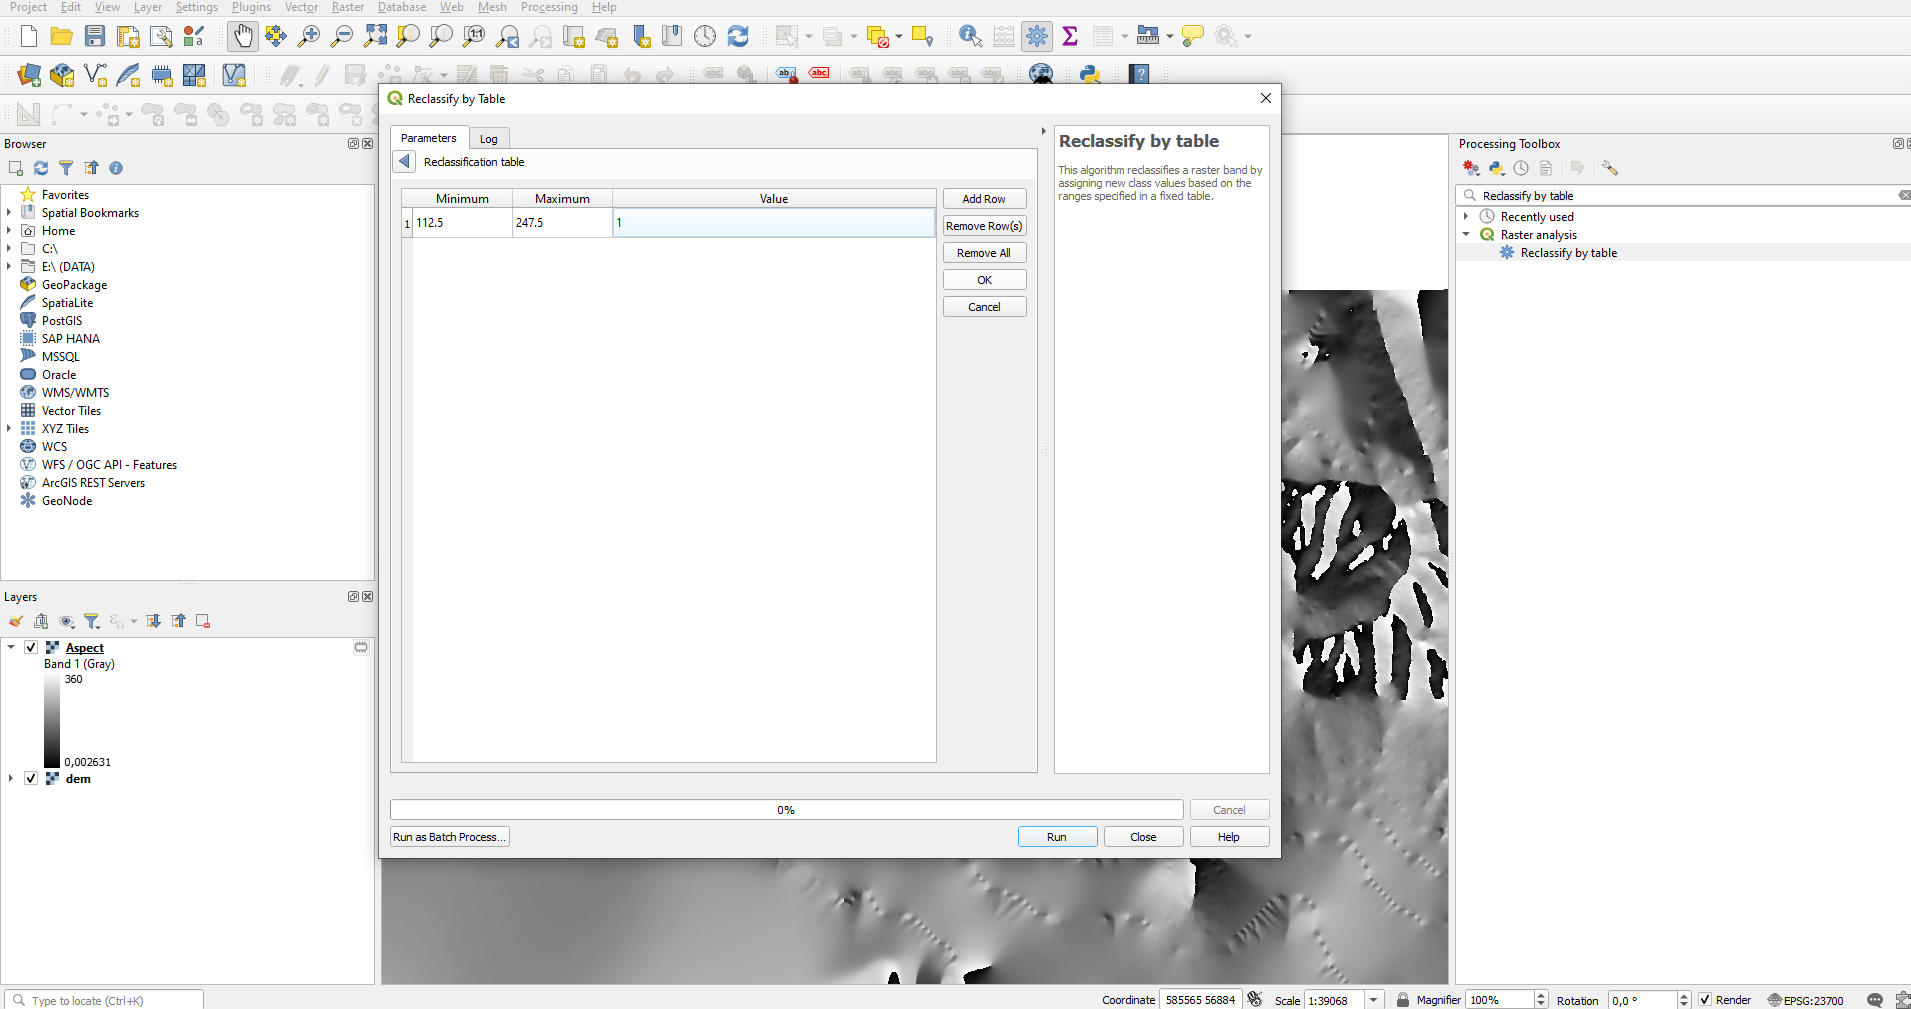
Search for the “Reclassify by Table” function in the “Processing Toolbox”. After opening it you should choose the aspect layer and then you can set the interval of the bearing angles under the “Reclassification table” option.
If you’re done, you may want to use the settings shown in the following image. Run the function!
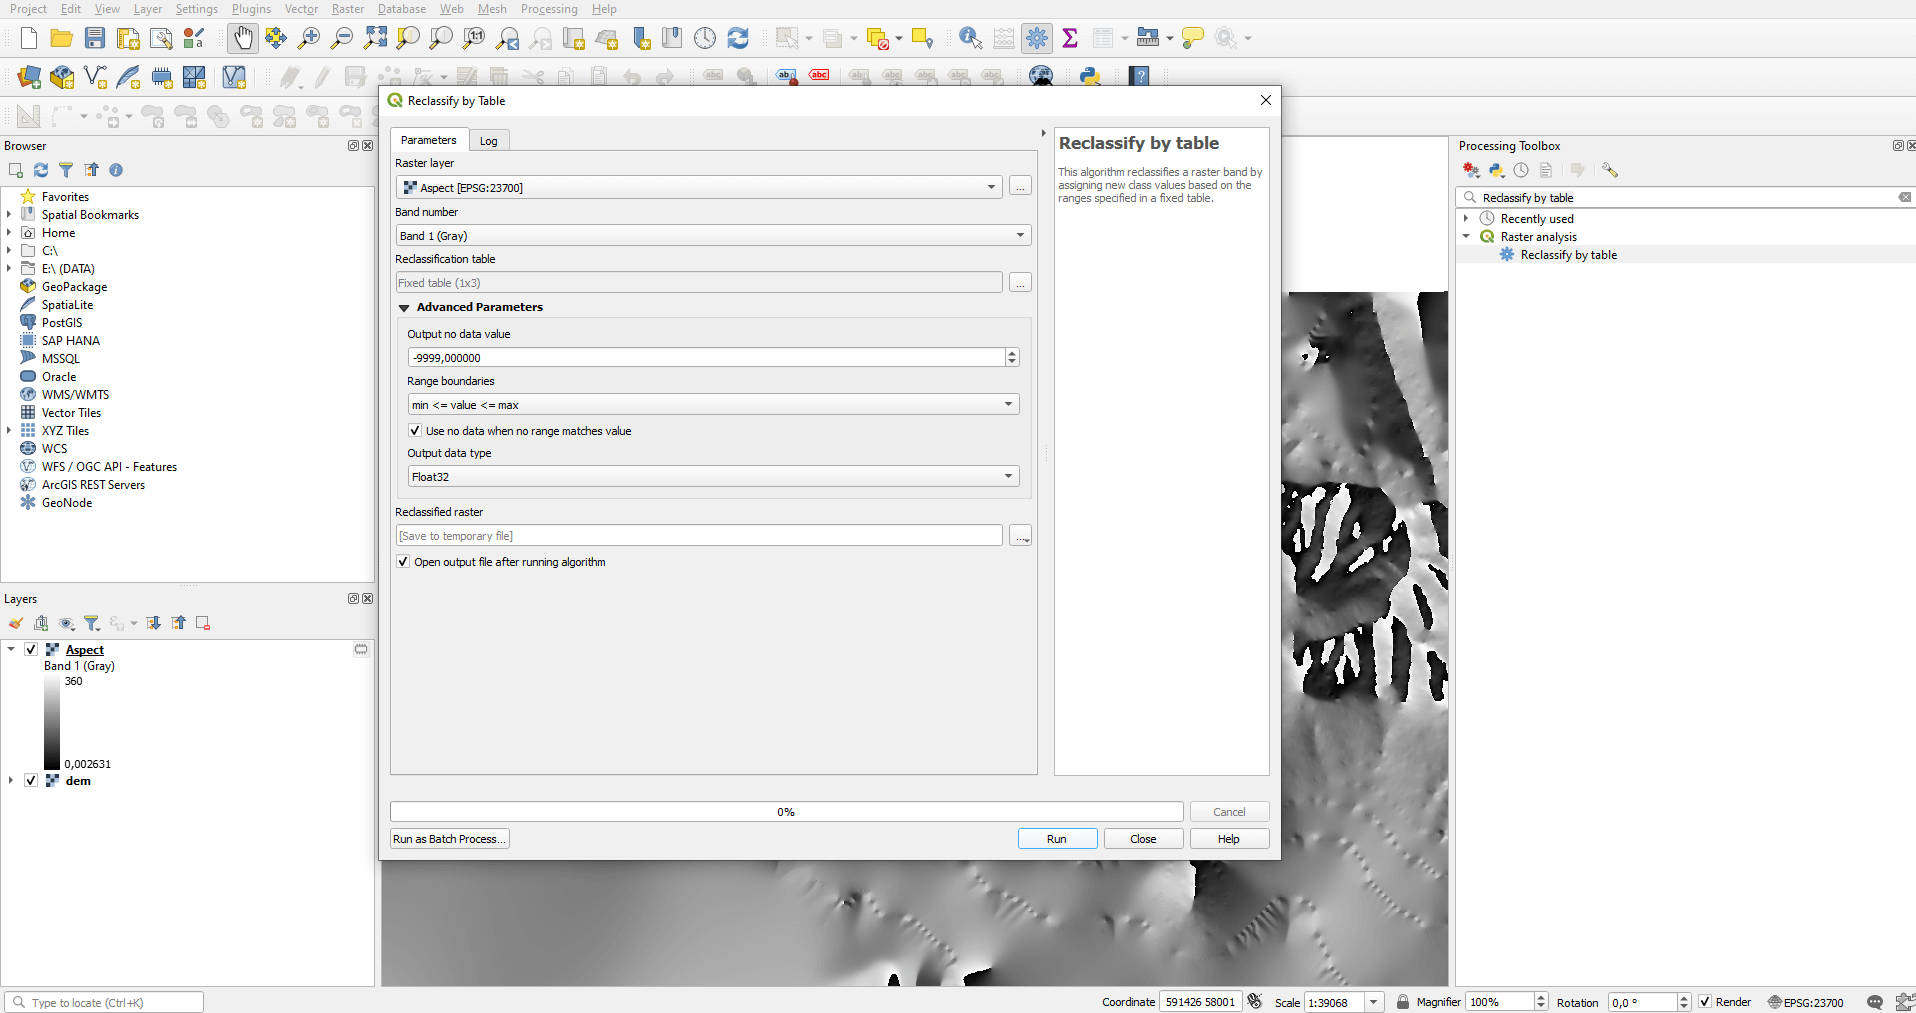
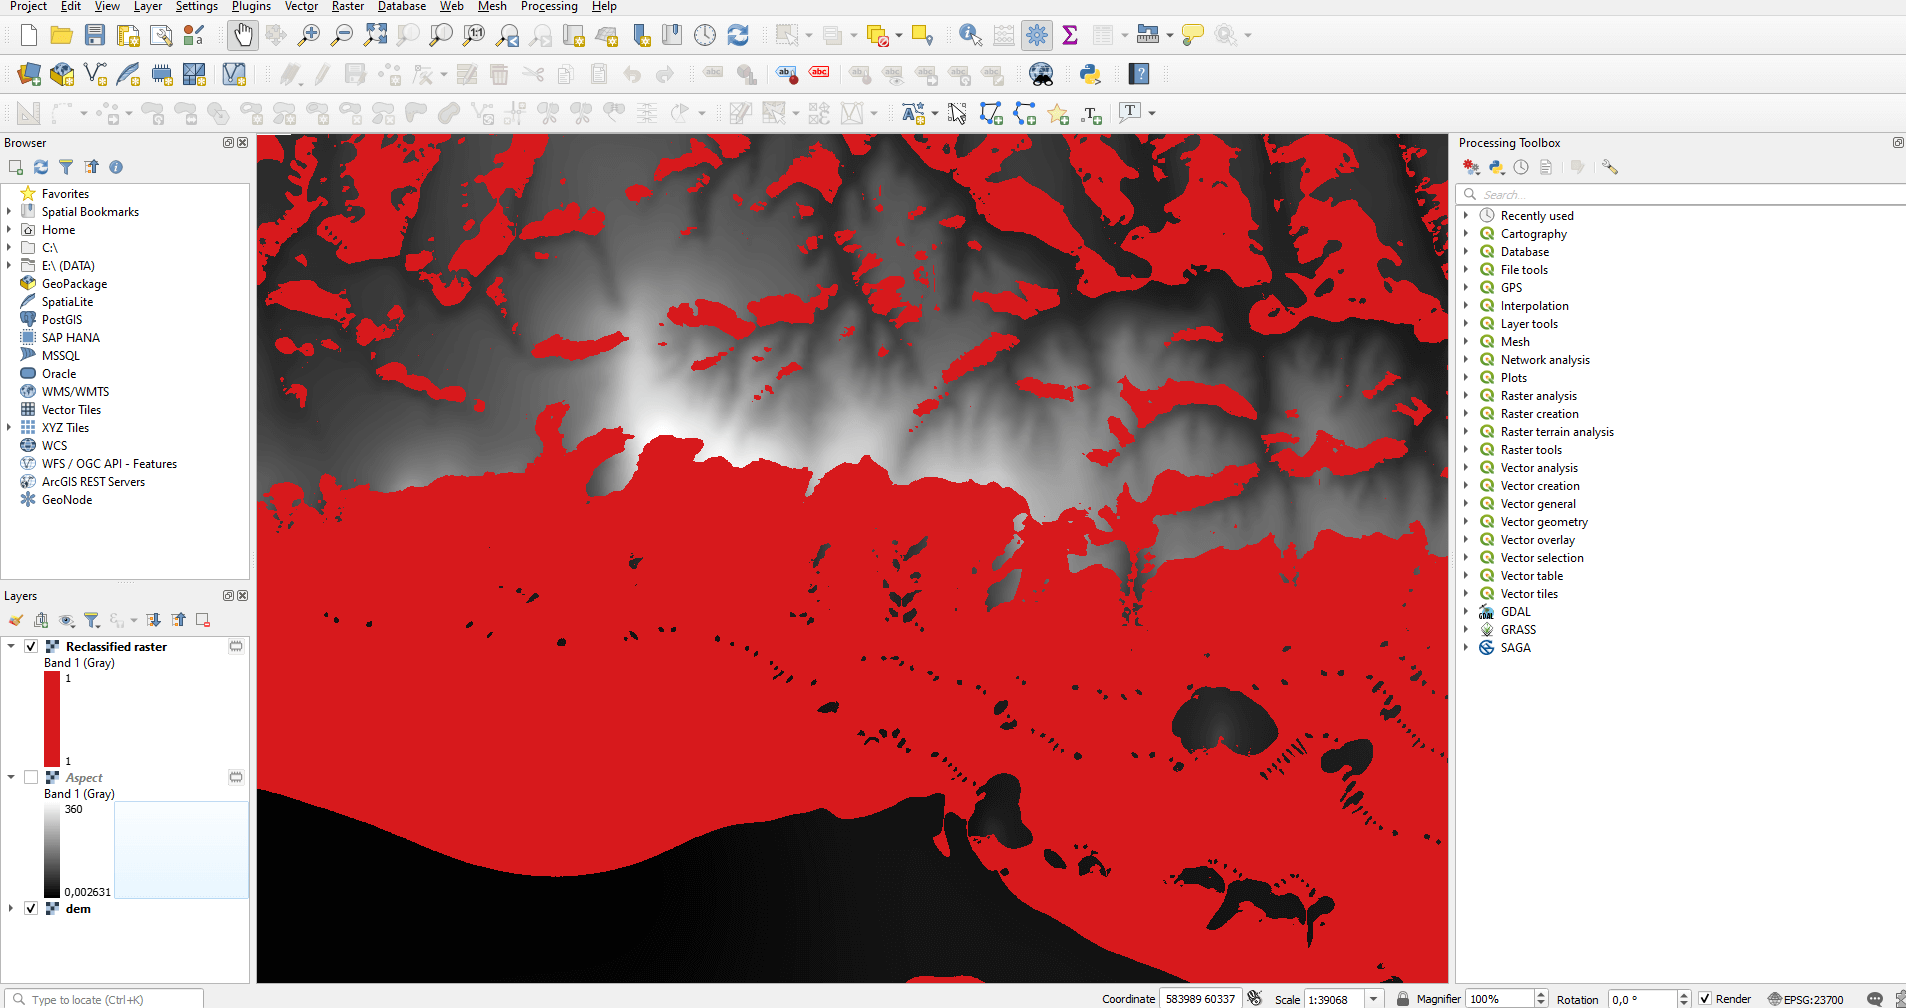
The southeast, south, and southwest slopes will appear on the result.
SLOPE MAP DERIVED FROM DRONE SURVEY
In viticulture, terracing is an expensive investment, but it is definitely recommended in the long run. Terraces can be classified into two groups: micro and macro terraces. Why is this important from a GIS perspective? Terraces can only be placed on slope with 10-20% slope (5,7-11,3°). Slopes with higher angles are matters of discretion.
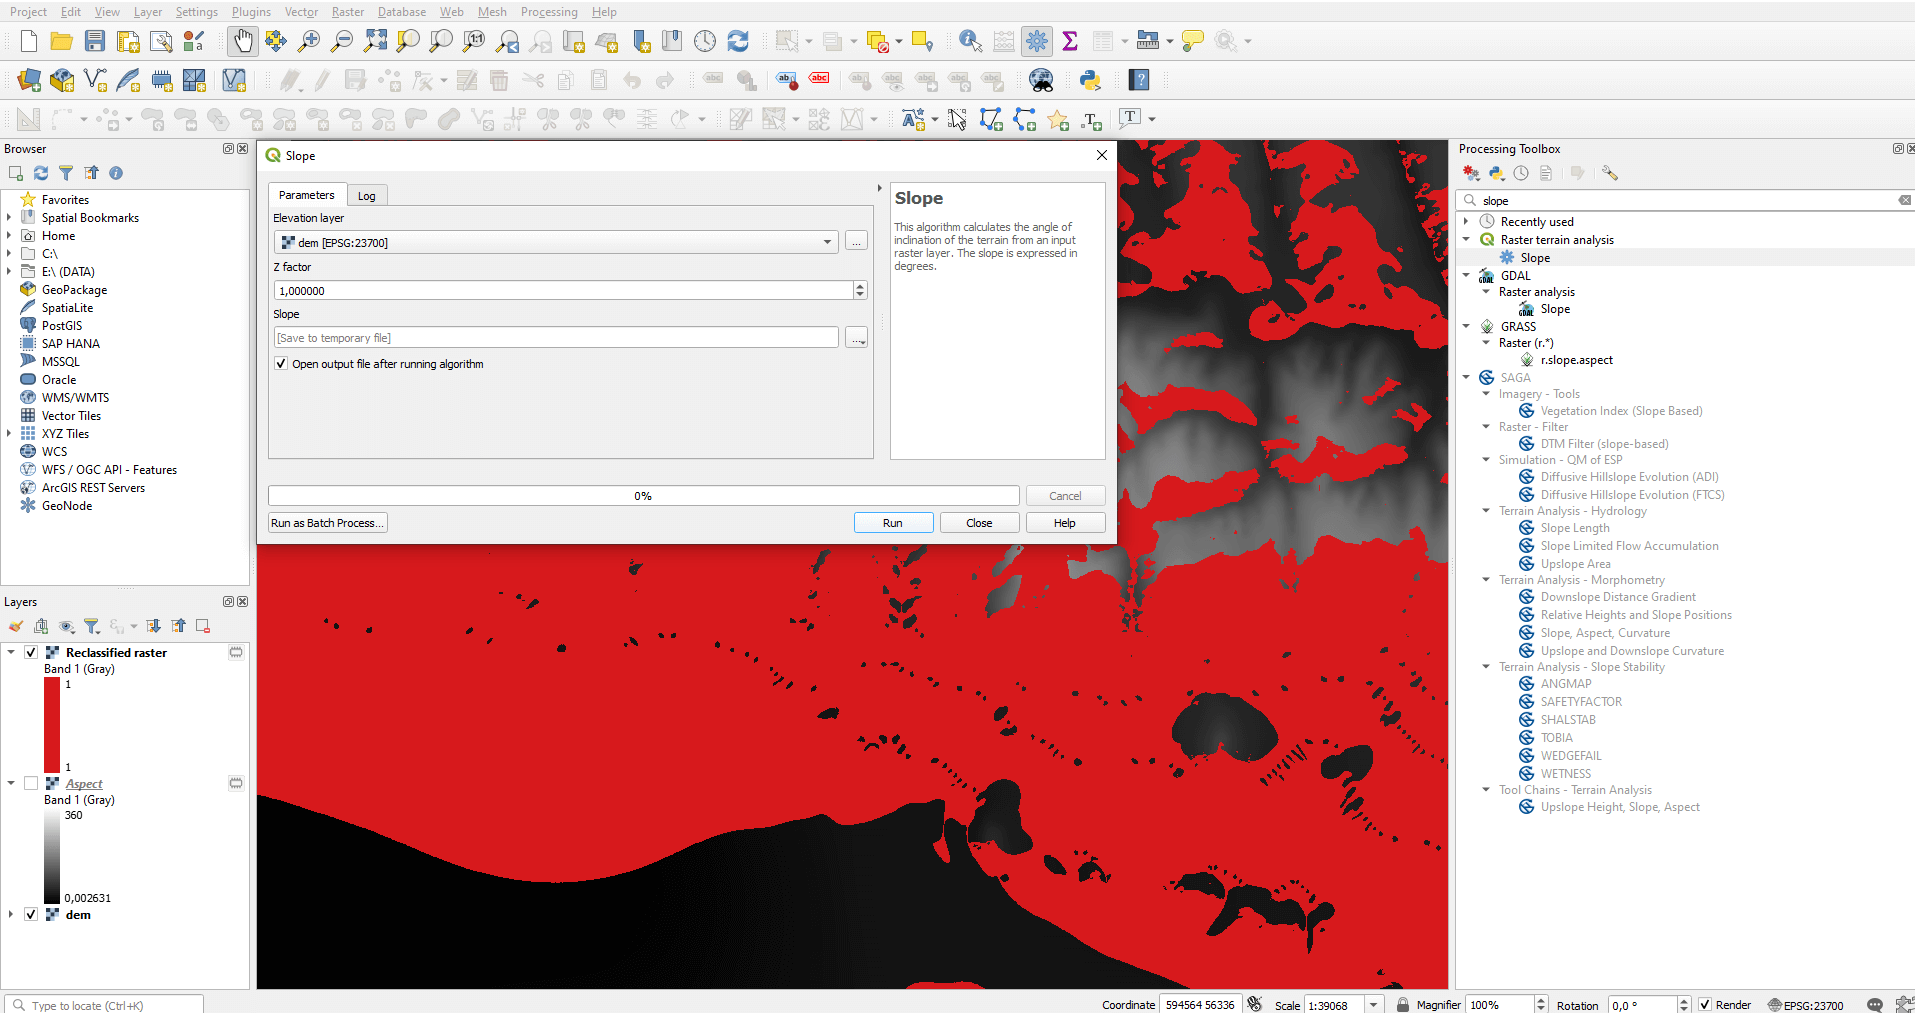
In QGIS use “Processing Toolbox” once again and type in “Slope”. Choose the first option and run the function on the DEM.
We need to reclassify the result, just as we did with the exposure. Use the previously presented “Reclassify by Table” function and set an interval of 0-11,3°.
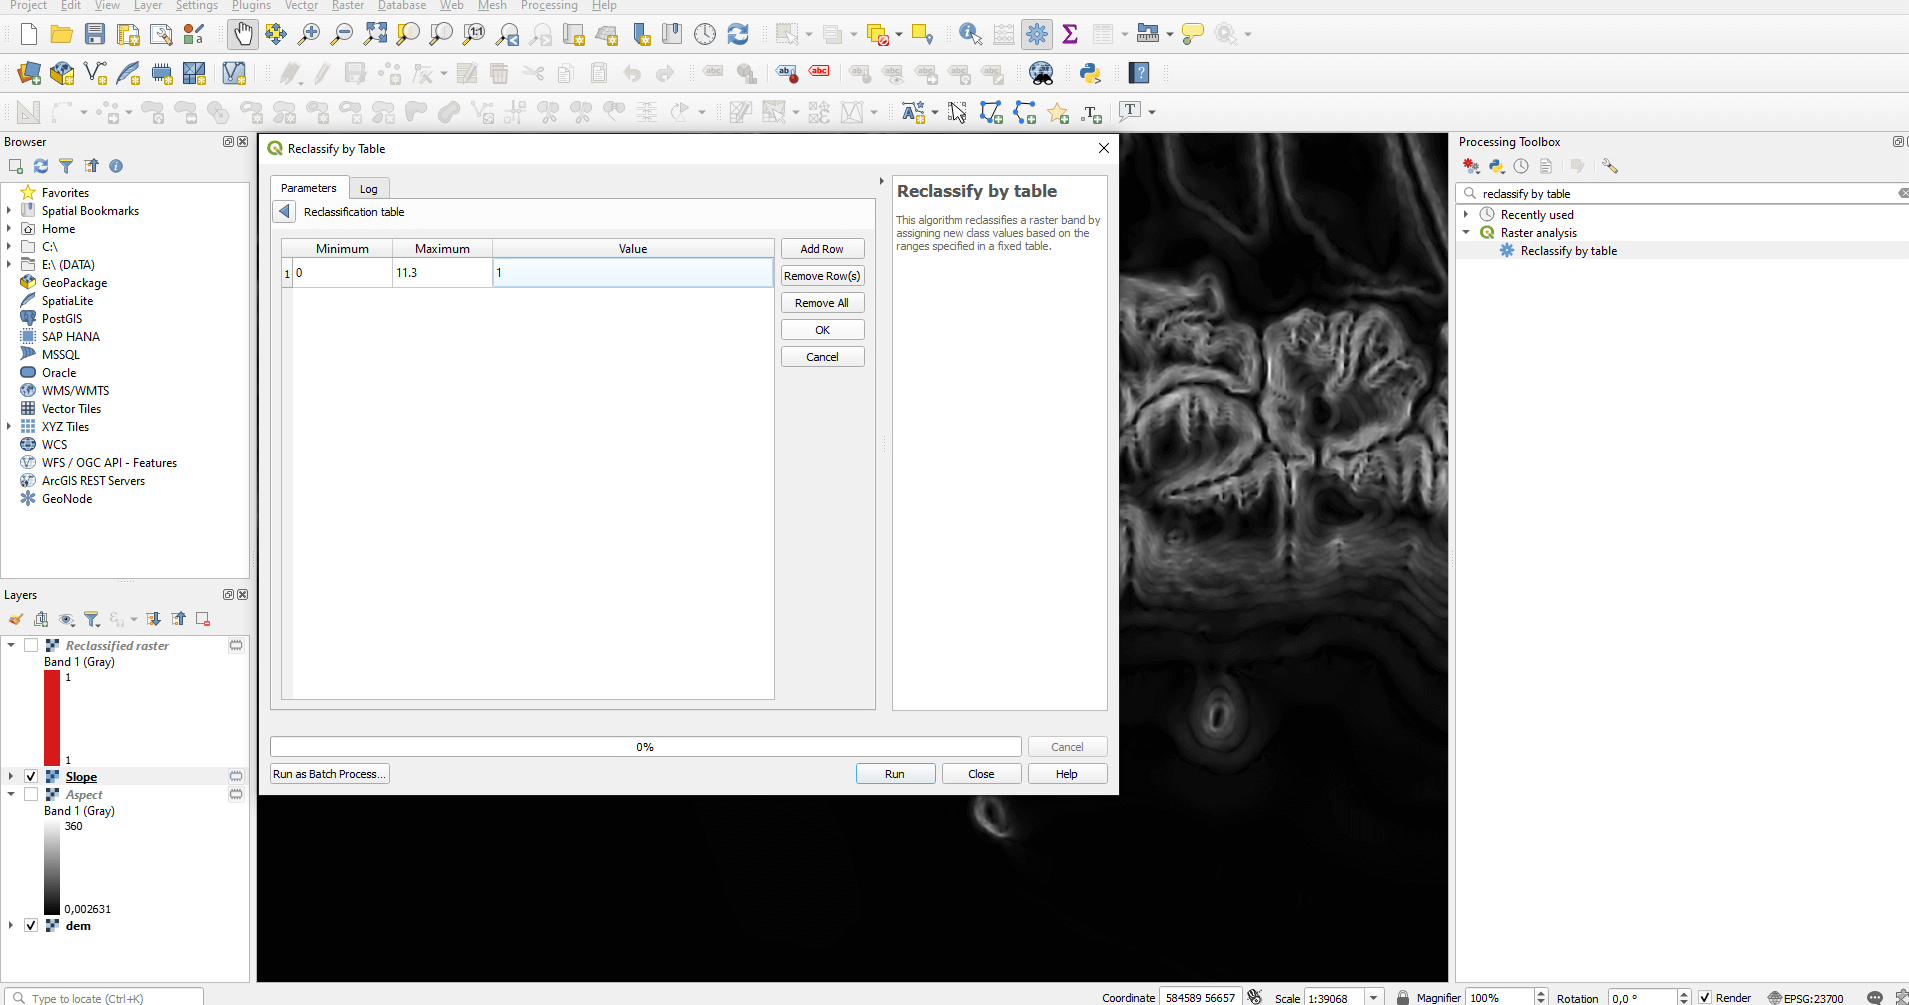
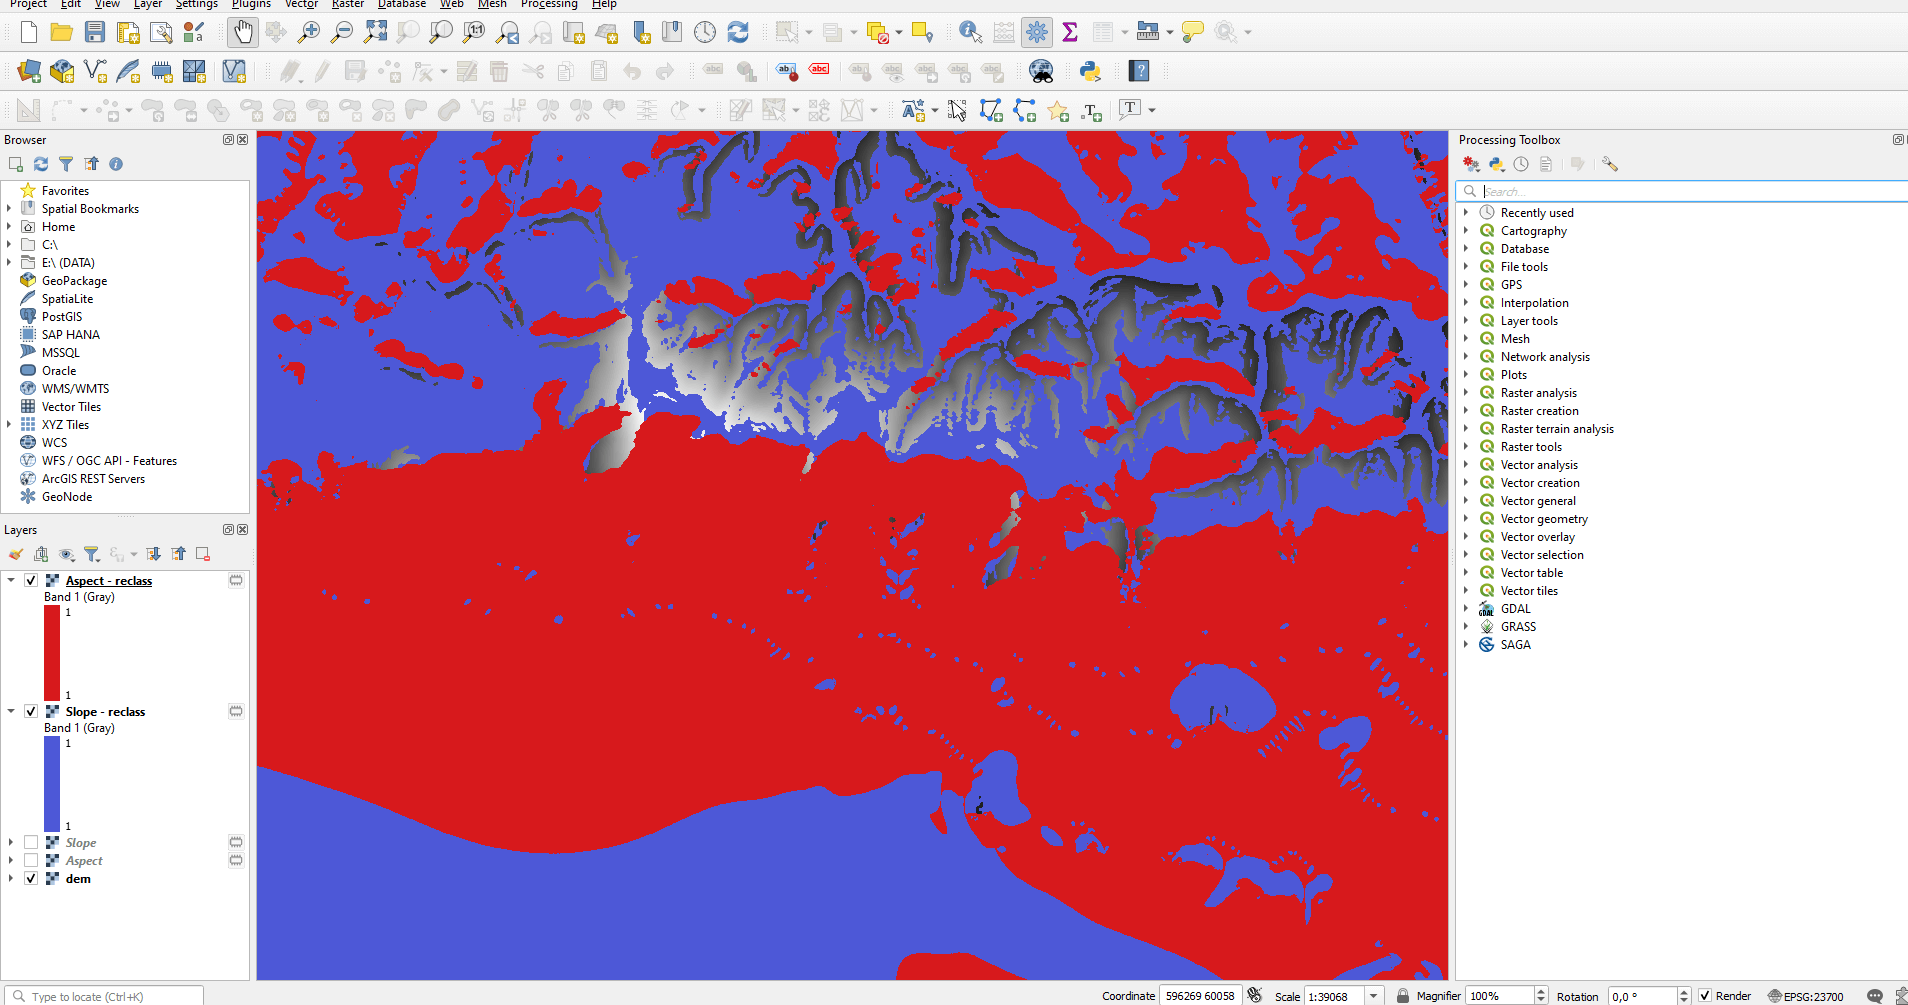
Fill the basic settings like I’ve shown you with the aspect. The result clearly indicates that there are overlapping areas, those areas are suitable for viticulture.
IDENTIFICATION OF AGRICULTURAL LAND BASED ON DRONE SURVEY
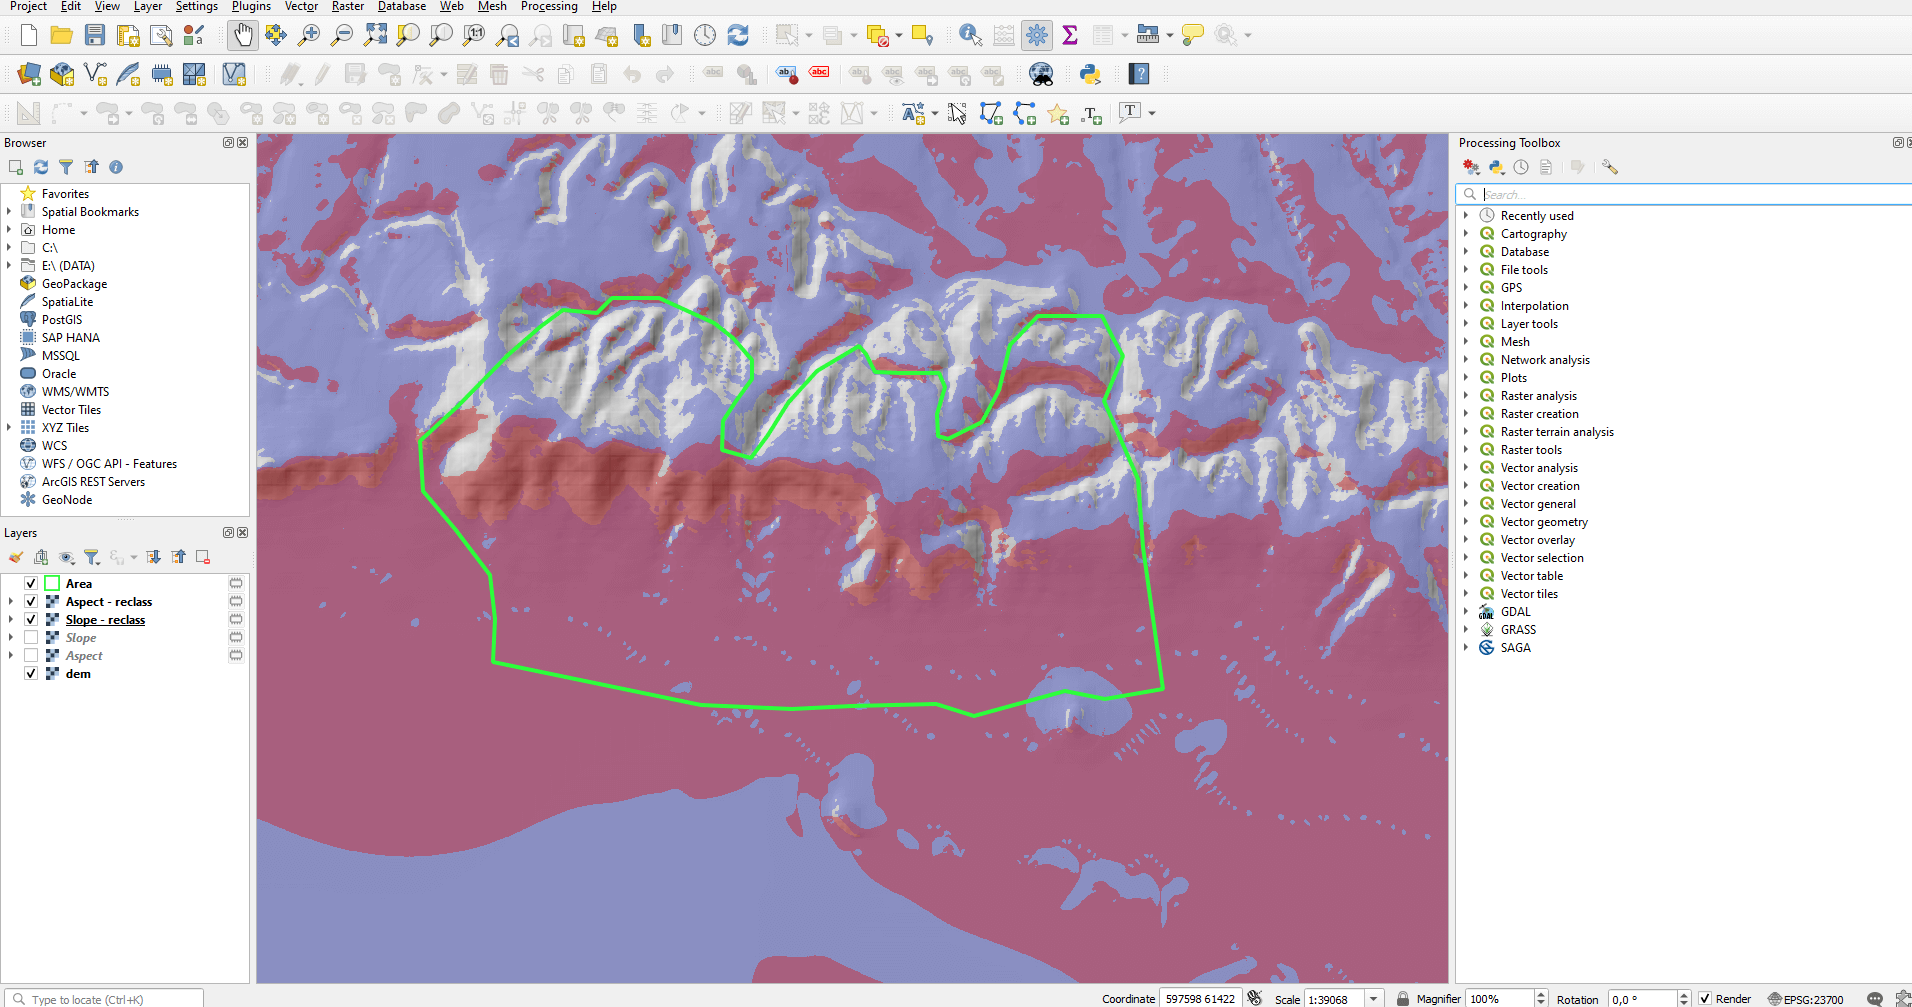
Let’s assume that we need to narrow down our area. The border of the crop land is marked with the green line on the following screenshot.
The reclassified exposure and slope map can be narrowed with the “Clip raster by mask layer” tool. Of course, this can be done with one step if you crop the DEM file with the same polygon at the beginning of the whole process.
The next step is to find the areas with appropriate exposure and slope. To do so, open the “Raster Calculator”. When calculating raster files, the narrowed areas must be multiplied, as the multiplication always finds the common section.
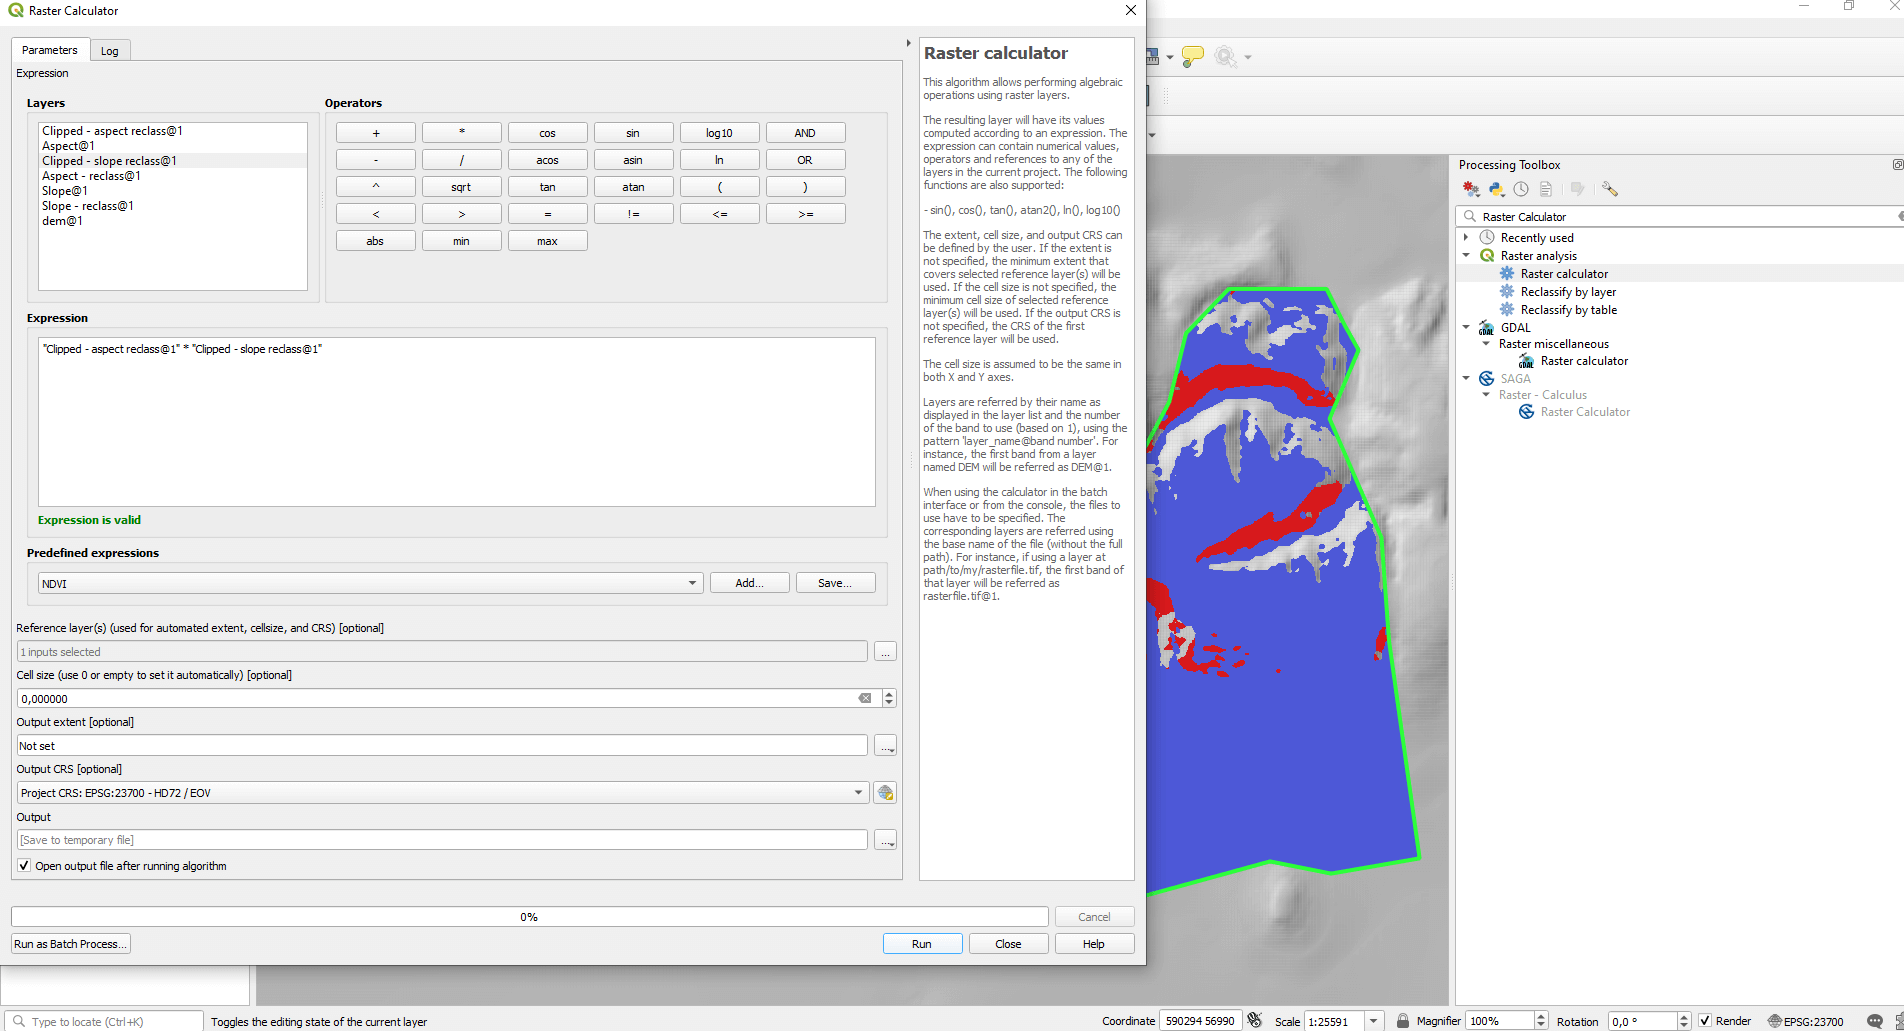
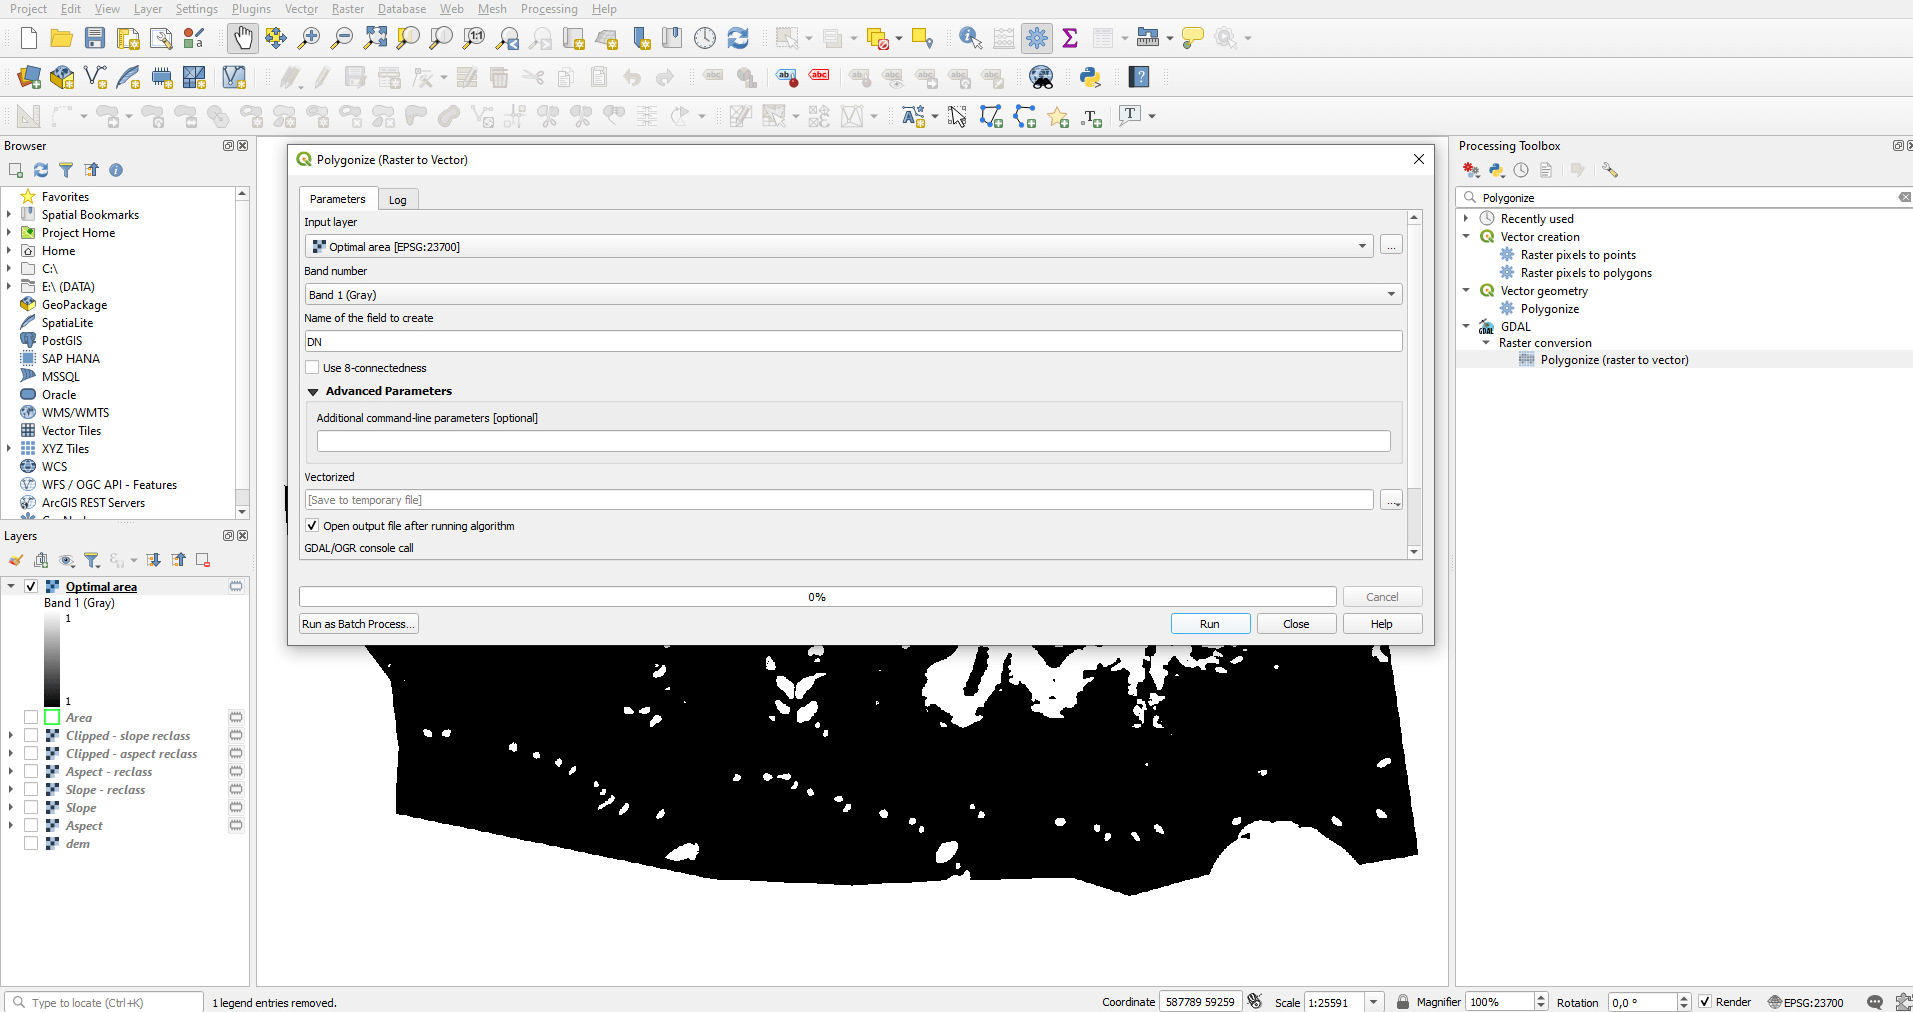
The appearing rasters show the optimal areas. From the economical aspect, the main question is the size of those subareas and the whole area. Here you have two options: do the calculation with a raster file, or vectorize it and do the analysis on the vector areas. I personally recommend the vectorization, because this way you can calculate the area for both the patches and the whole area. While on the raster file you can only calculate the area of the whole surface with the “Raster layer zonal statistics” function. In the current example we’ll be calculating with vectors. Search for “Polygonize” and run the first GDAL function on the raster result.
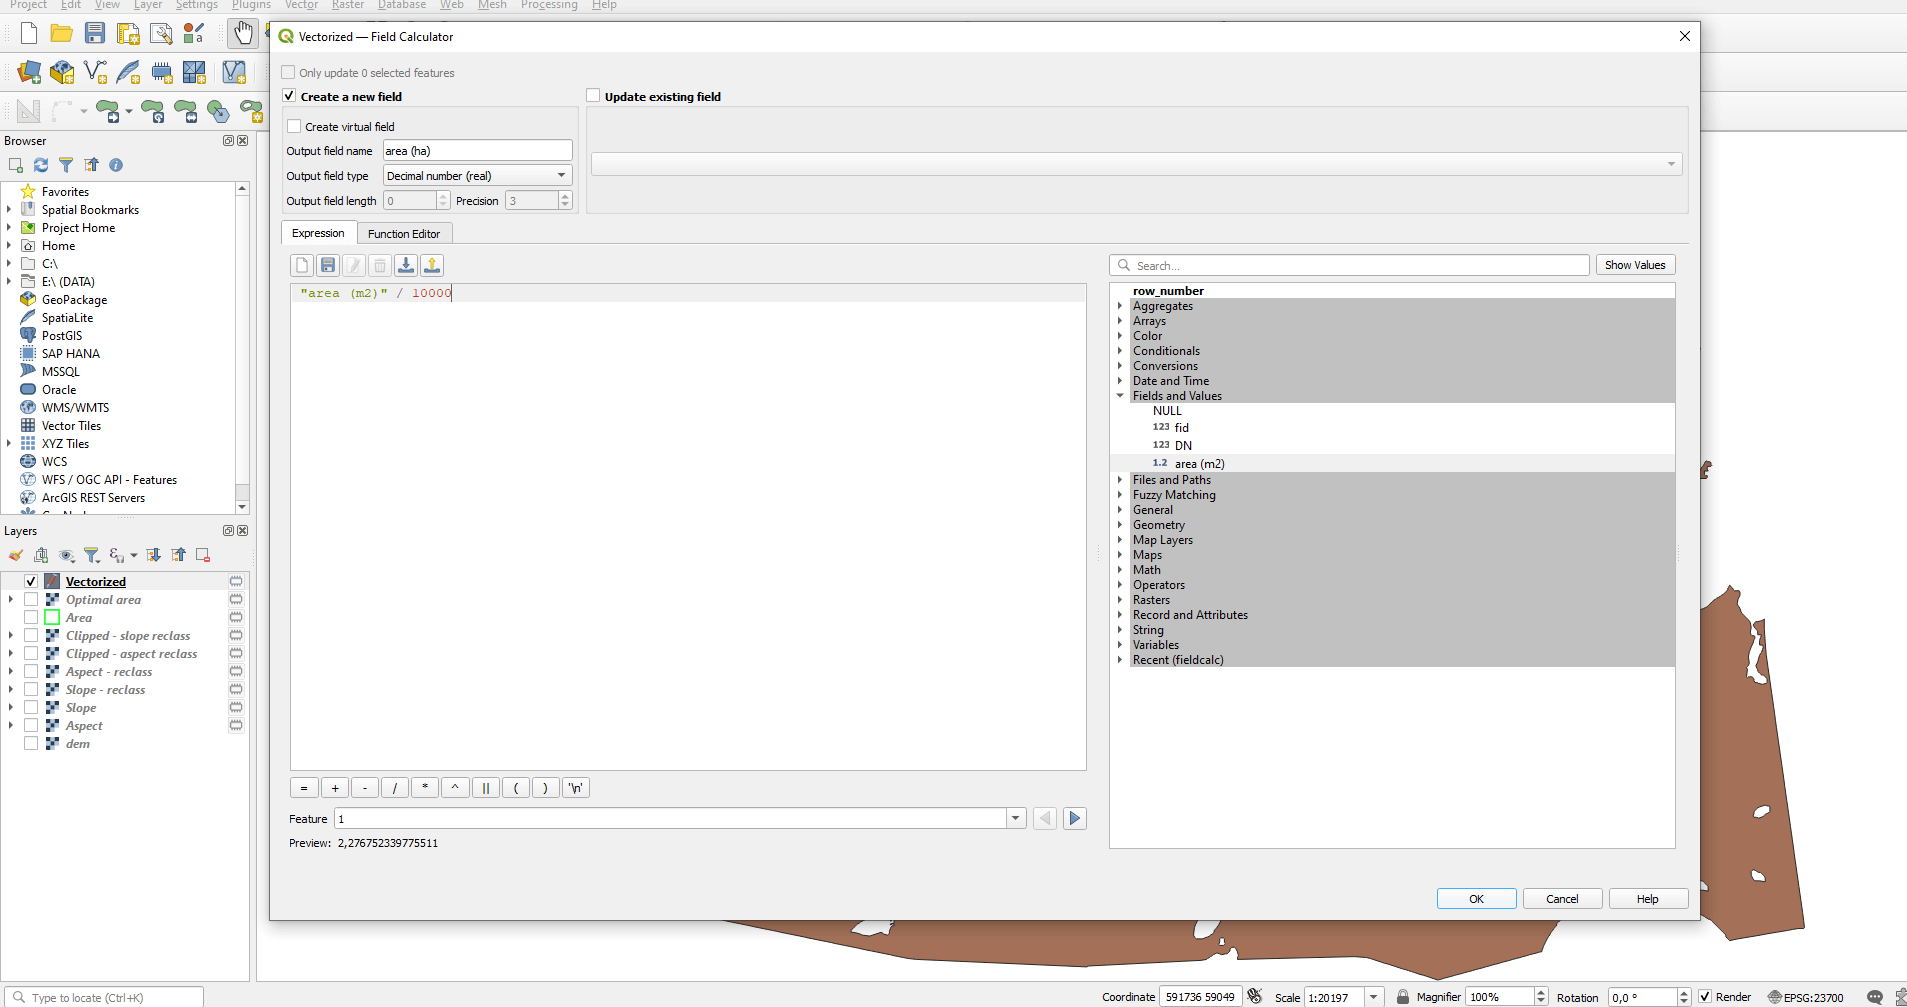
The vector layer will cover the same area we have previously selected. Open the attribute table of the new vector and create a new column with the “Field calculator”. We can fill it with values derived from the coordinate system by using the „$area” command.
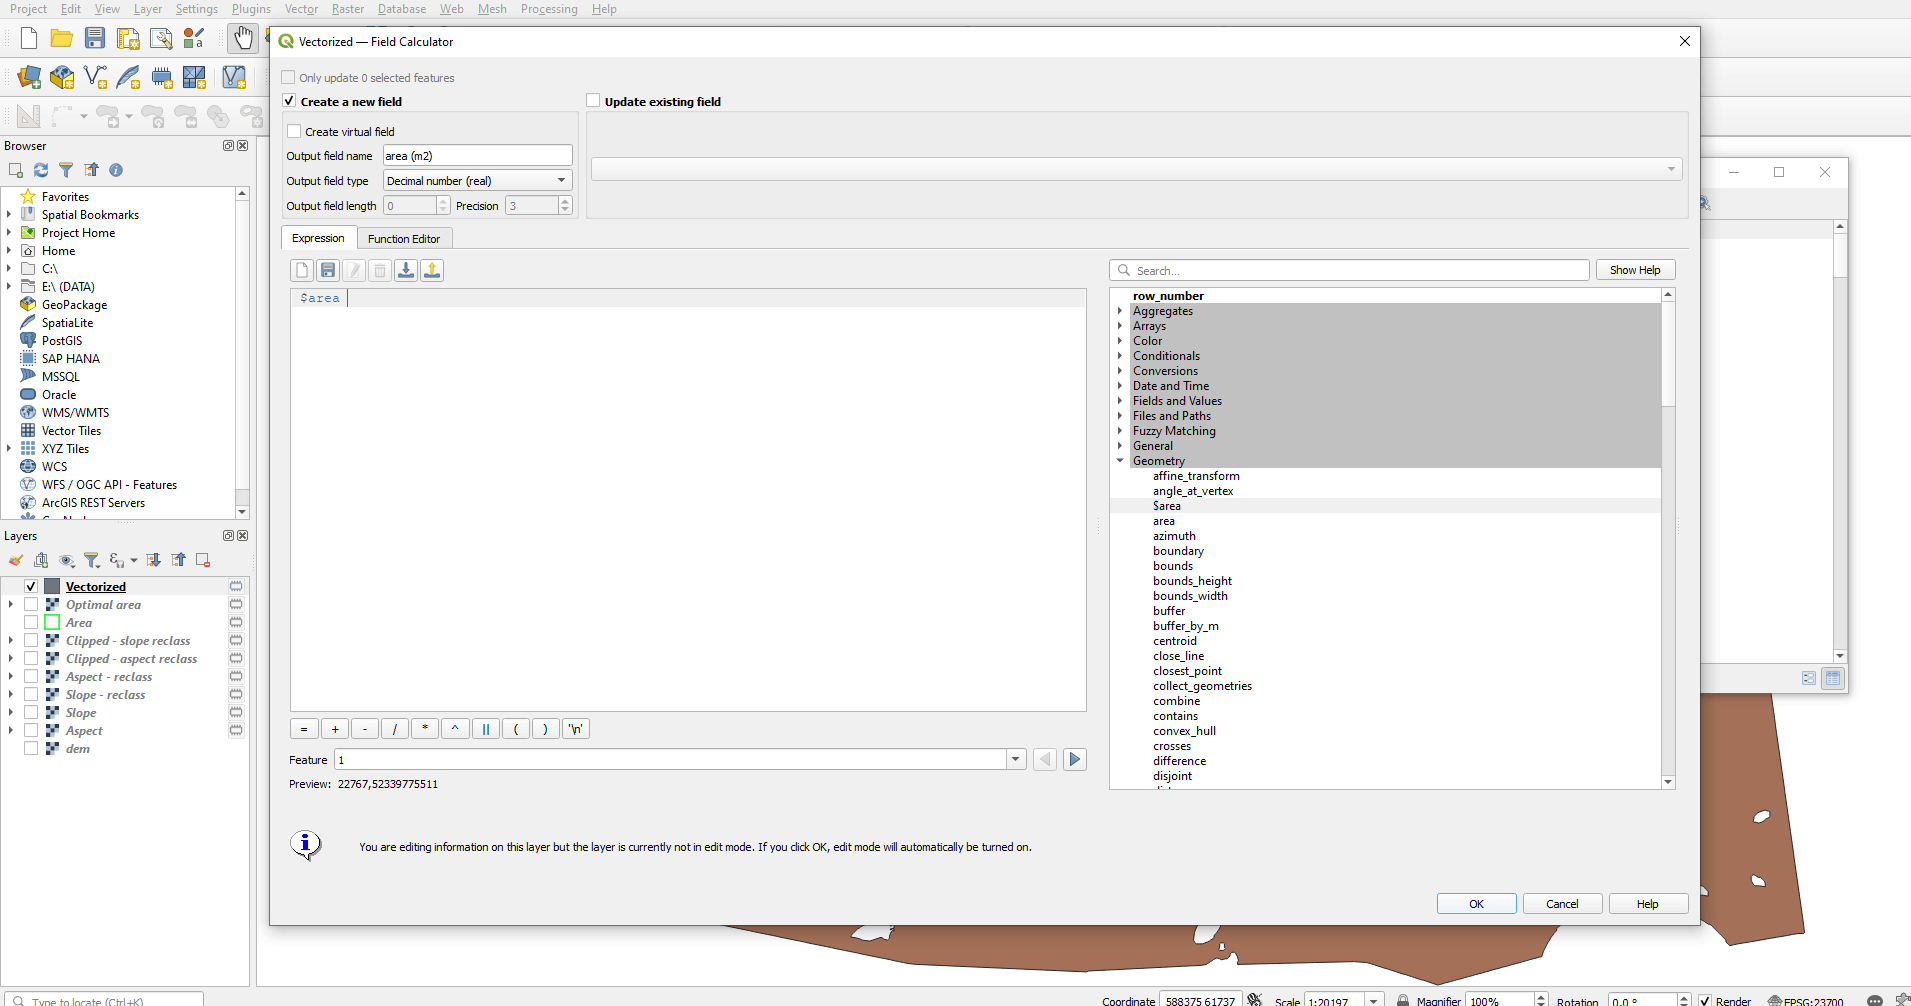
You can even convert this to acres if you are more comfortable with it.
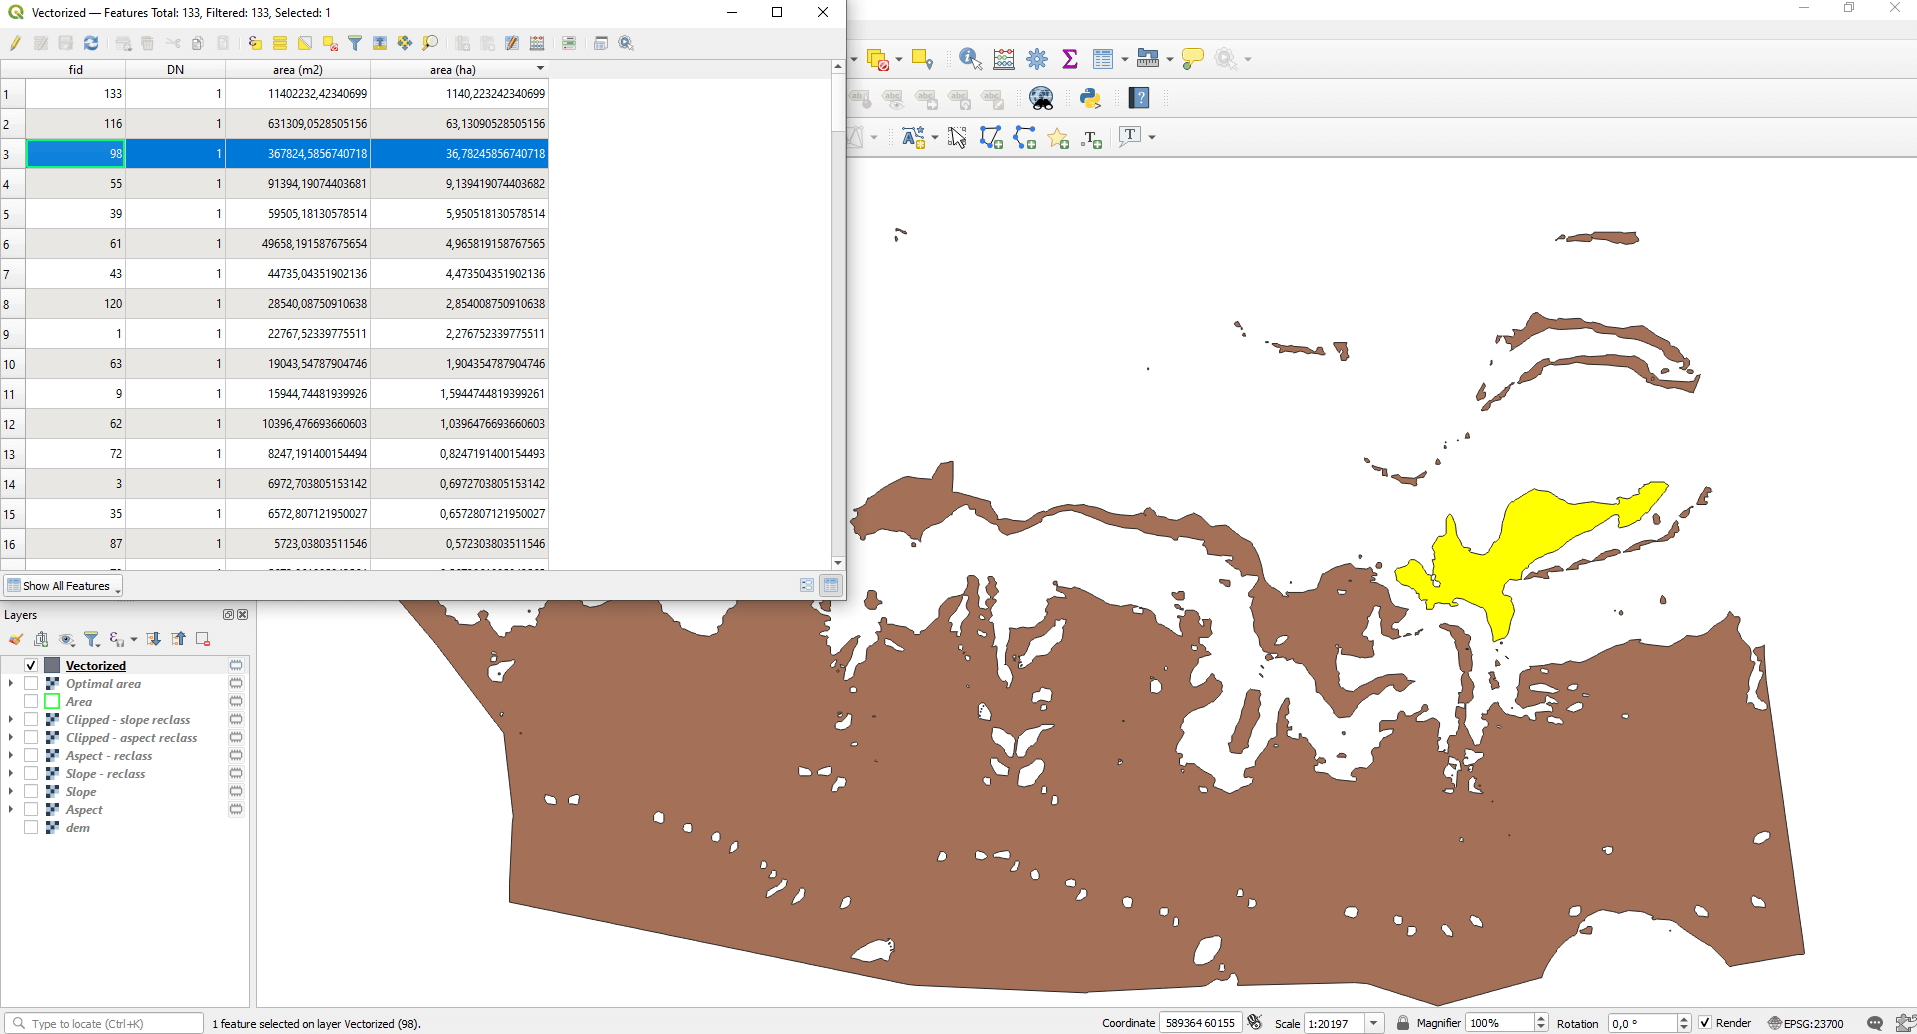
Here you can select each subarea one by one and read the value that was associated with it.
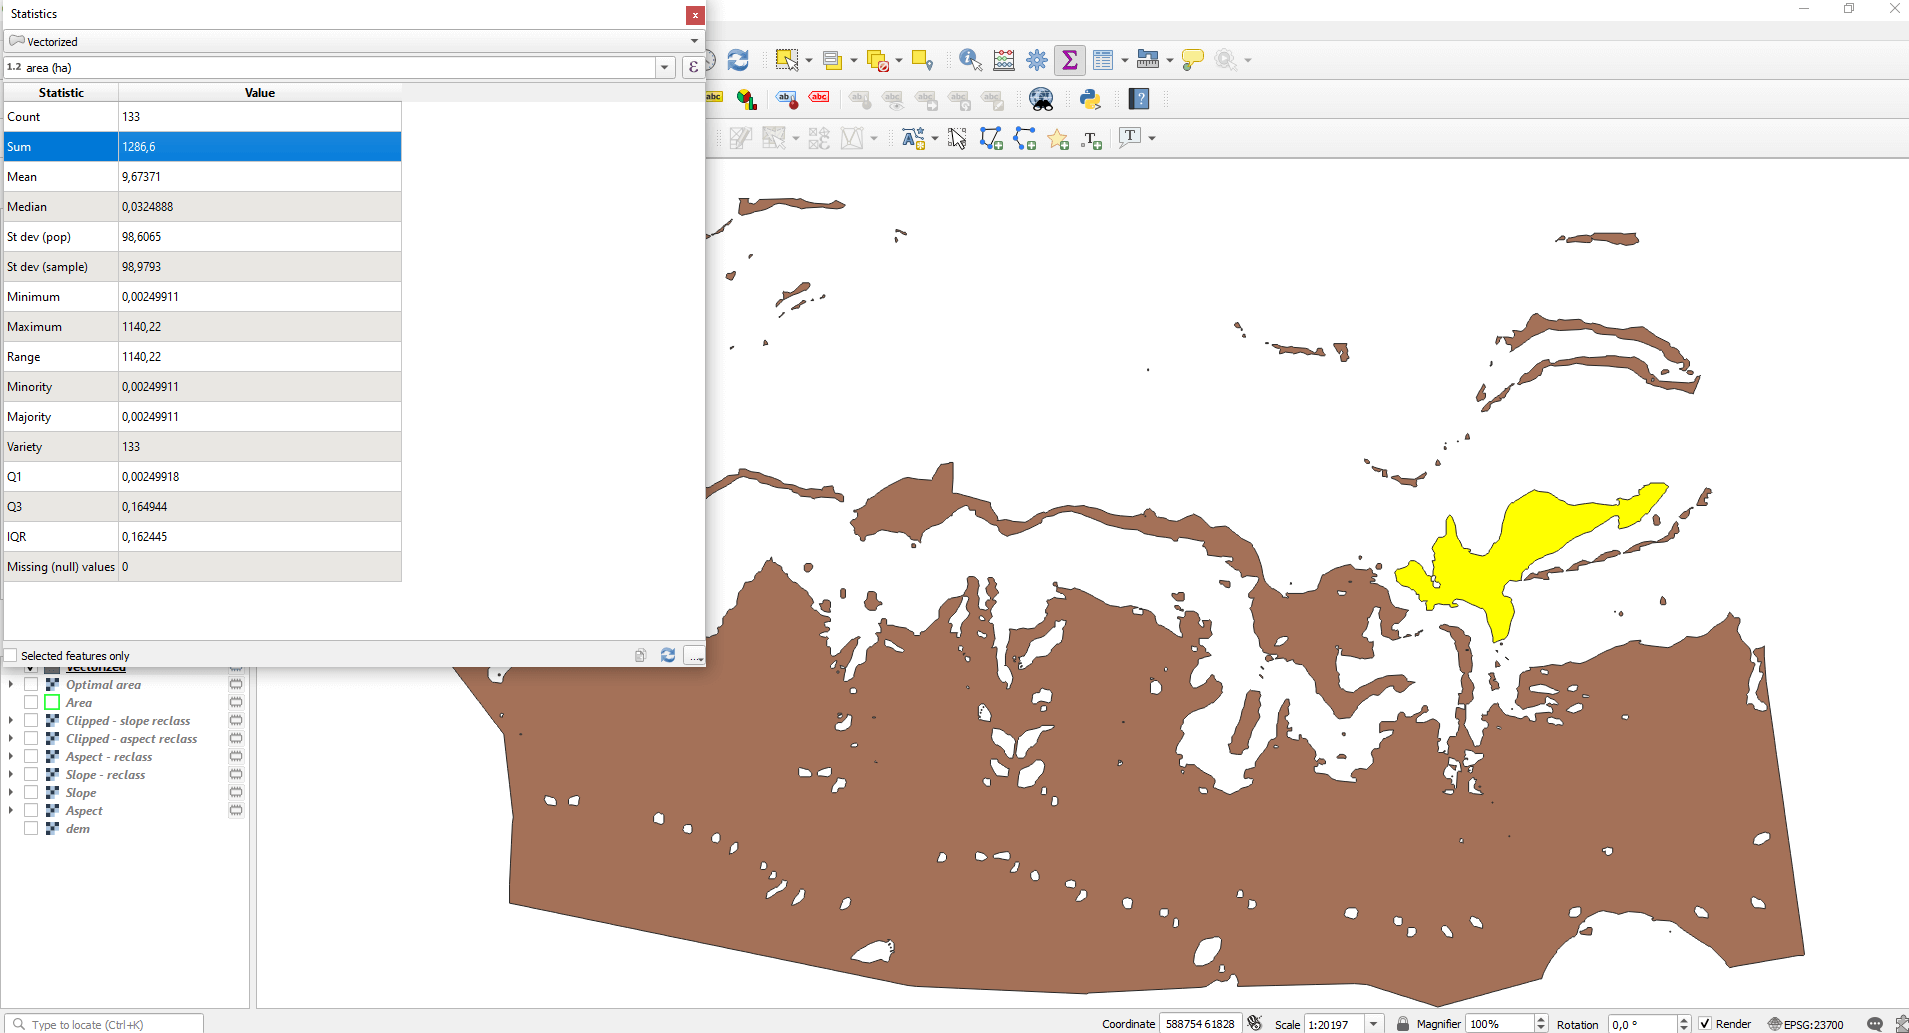
If you select Show statistical summary” icon in the top menu bar, you’ll be able to see the summarized values.
CLOSING THOUGHTS
In agriculture other modifying factors may have spatial relevance that we can incorporate into the study. These include the distribution of soil types, prevailing wind directions, altitude, precipitation distribution, runoff conditions, soil mineral content, water index (NDWI), vegetation index (NDVI), and so on.
Sidenote: From our previous article you can learn how to create NDWI and NDVI maps by using Sentinel-2 satellite images. These can be applied in the area filtering, just as we’ve shown it in this current article.
If you don’t have a database from a primary data collection at hand, take a look at FAO’s (=Food and Agriculture Organization) website, because there is a lot of free databases available to use.
If we need to select areas based on a complex criteria system, it’s called GIS modeling. A GIS model is made to thematically display the result of our analysis in a map or 3D view, in a cartographically correct way. The GIS model helps us to understand the spatiality of most of the complex natural and social processes, by highlighting the information that is important to us (for the project) from the “gray noise” and interpreting it in an easy-to-understand form.
I hope the article helped you imagine how drone survey and agriculture and GIS can be effectively connected.
Did you like what you read? Do you want to read similar ones?