
Designating VLOS calculation is crucial in a drone mapping project. Calculating line of sight areas means identifying points from which the drone pilot can visually see the drone while it performs the mapping mission. What is VLOS?
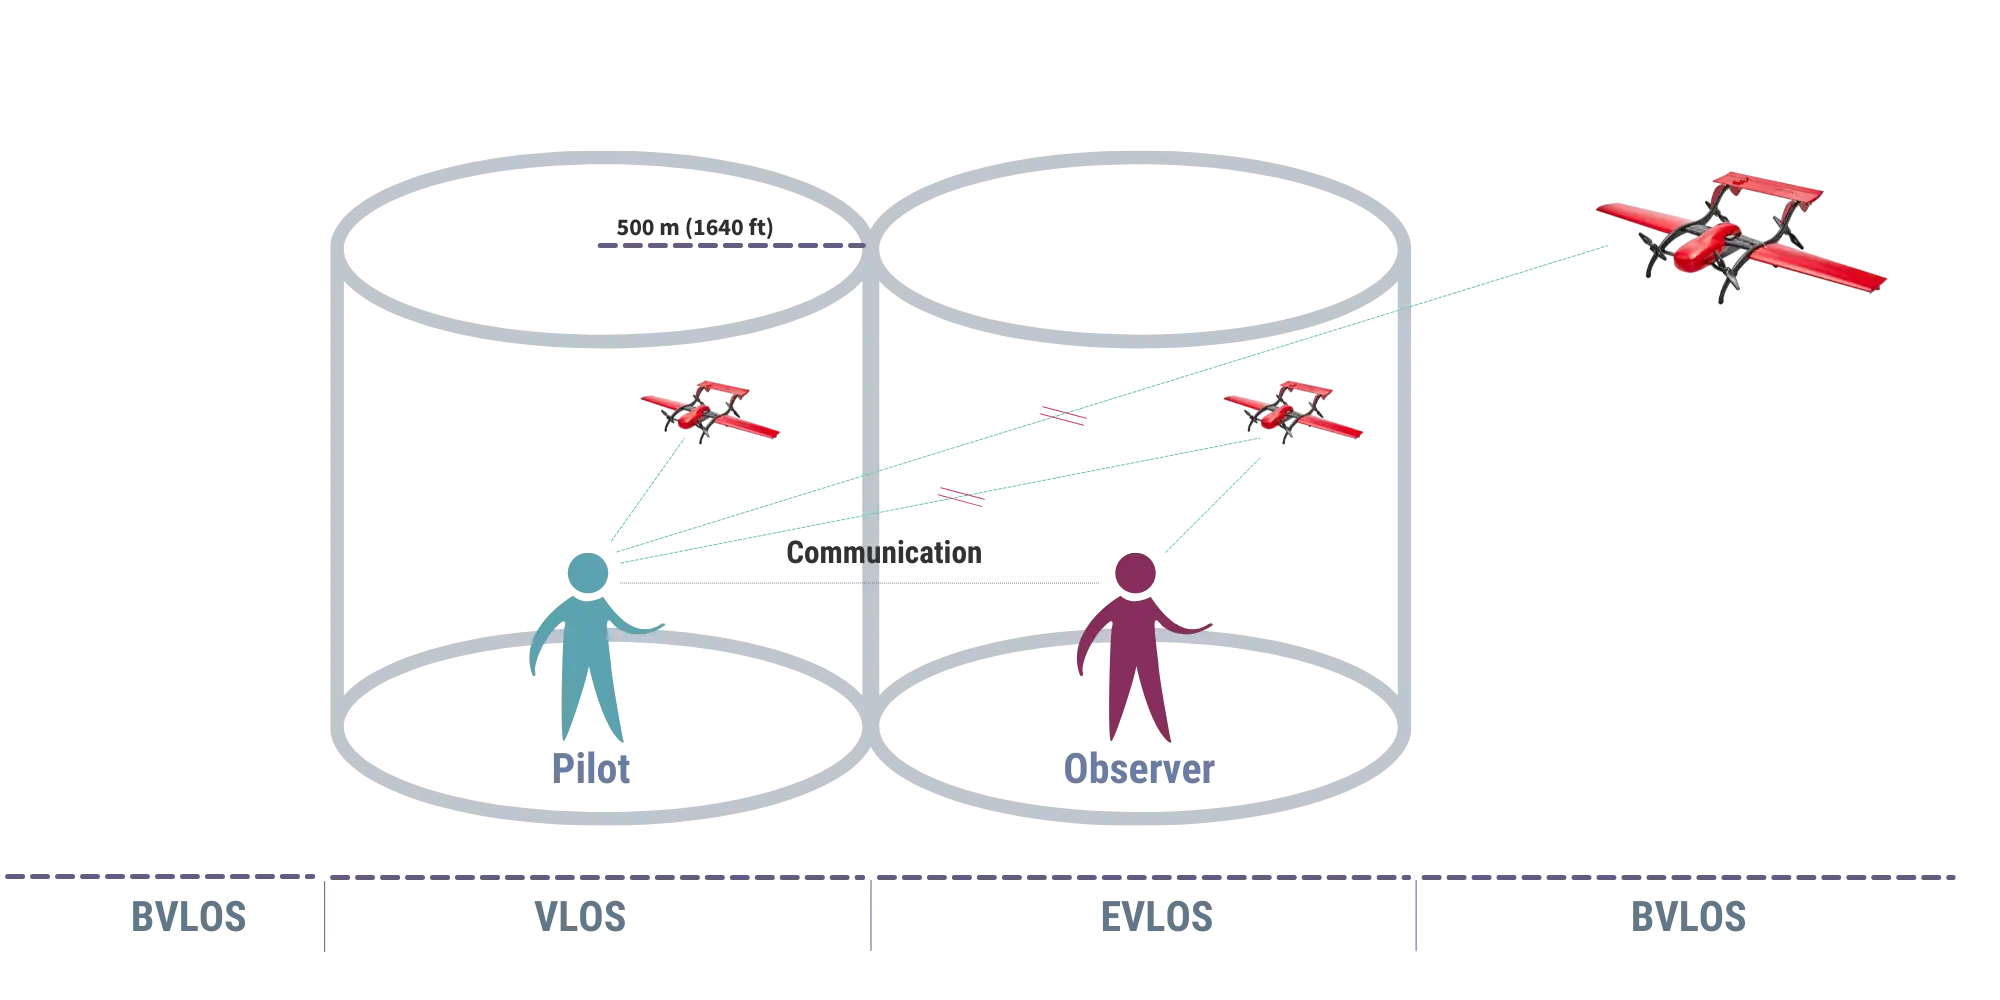
VLOS stands for Visual Line of Sight, meaning that the drone during the entire flight mission must be clearly visible by the drone operator without any additional aid – equipment such as binoculars, FPV goggles etc. The operator monitors the area and controls the UAV to avoid any collisions or obstacles.
EVLOS stands for Extended Visual Line of Sight. This allows to operate a drone further than VLOS by using one or more visual observers. The observers must be trained and instructed. During the flight observers keep a visual contact with the drone and communicate with the drone operator about observations and alerts the pilot if necessary.
BVLOS stands for Beyond Visual Line of Sight. In this mode, the drone operator does not maintain visual contact with a drone at all times, and the drone is able to carry out a mission without assistance of observers. The drone operator uses a remote pilot station or ground control station to monitor and control the mission.
Definitions and infographic from Fixar.pro.
Two functions can be used for VLOS calculation in the free QGIS software: GRASS and GDAL. Both are available under the name “Viewshed”. The function suitable for VLOS calculation can only deal with points. The Viewshed function is based on the point geometry from which you should launch the drone for mapping. The function calculates the visible areas (VLOS) from this point.
Complicating the situation is the likelihood that you may not know where the optimal points are. However, it is sufficient to designate multiple areas within which you search for where to stand to see the drone.
The calculation of VLOS can be broken down into the following subtasks:
- First, designate an area.
- Generate points within the area.
- As a third step, run the “Viewshed” function for all relevant points, then calculate the visible areas of each point in hectares.
- Finally, select the point from which the largest area is visible.
Designating VLOS Areas
If you want to generate a VLOS map in a drone mapping project, you will definitely need a digital elevation model (DEM). If you don’t have an appropriate DEM, we have previously written about acquiring and creating one; be sure to check it out.
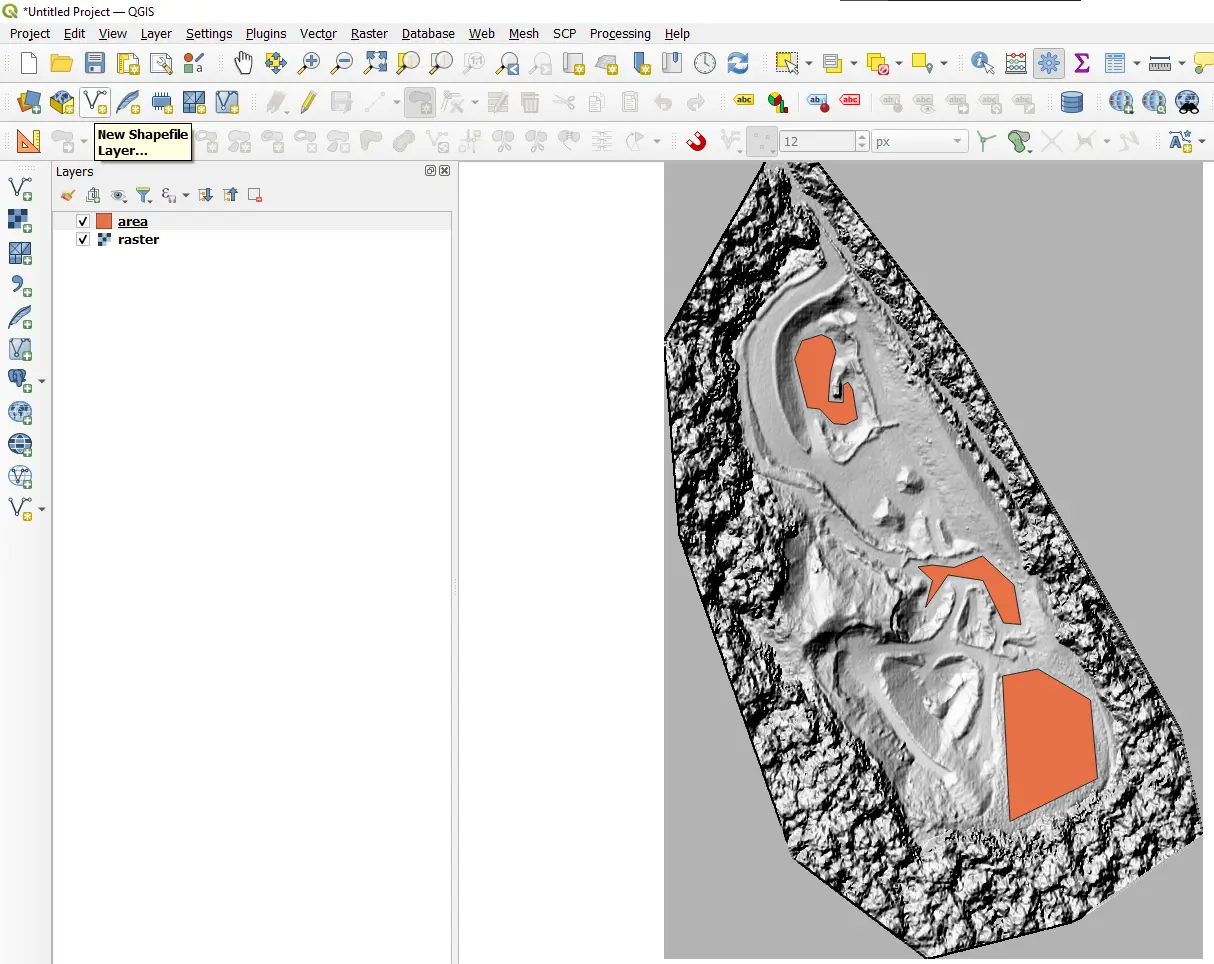
In QGIS, use the “New Shapefile Layer…” option to create a new file. By editing the shapefile, you can mark the areas you want to examine from a VLOS perspective. We have previously written about editing in QGIS; if you get stuck, read that article.
DISTRIBUTION OF OPTIMAL VLOS POINTS WITHIN THE calculation AREA
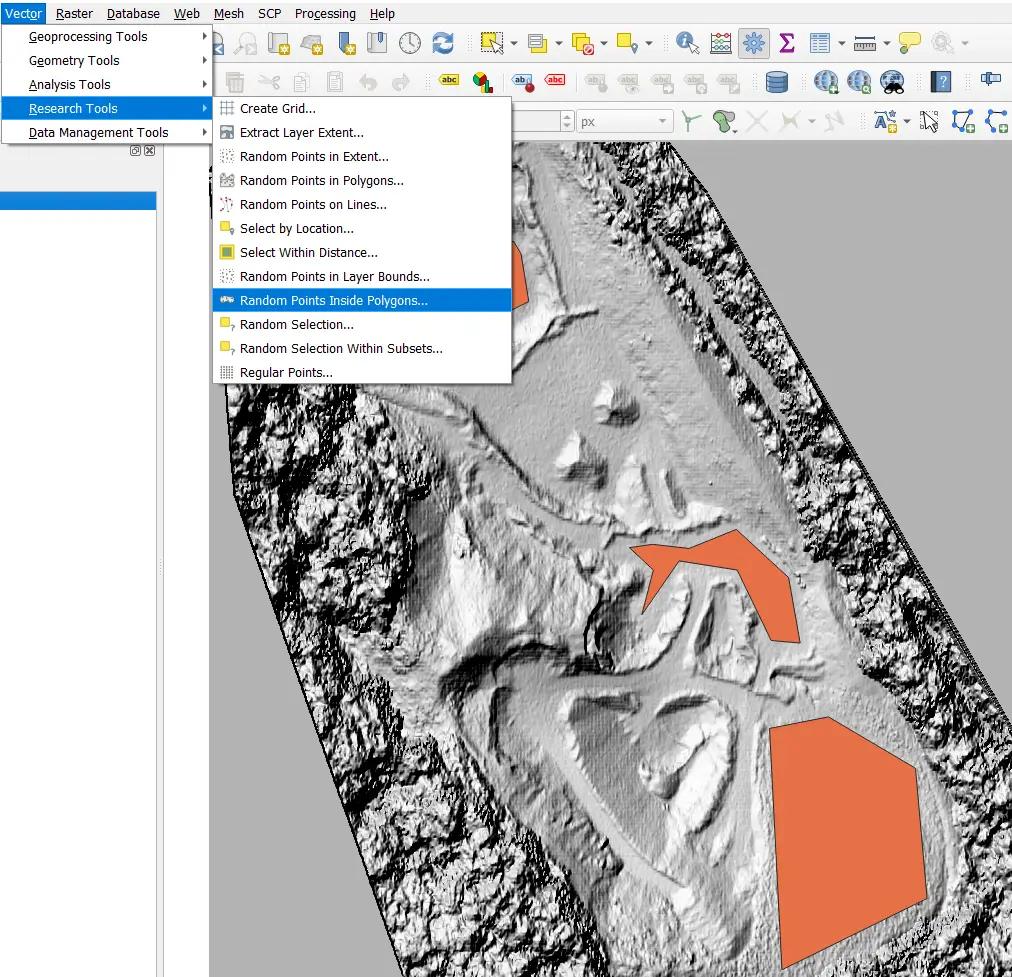
Within the designated areas, we select potential points. You can achieve the fitting of VLOS points to be examined by initiating the “Vector/Research Tools/Random Points Inside Polygons…” function.
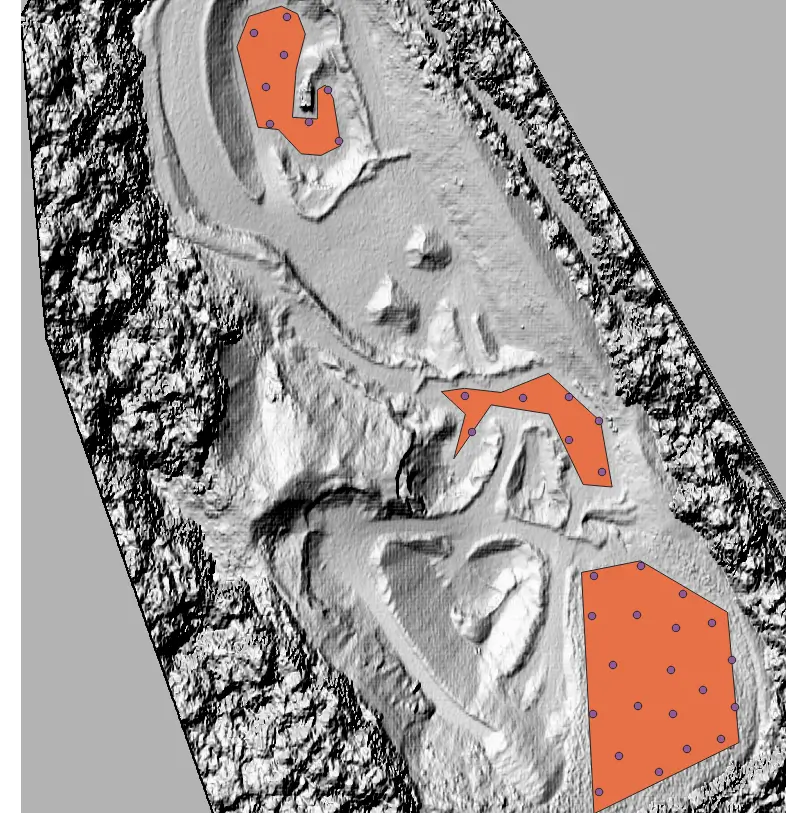
With the help of the function, we can place points within our selected area in a regular pattern. Select the designated area for the “Input layer,” then set how many points you want to place within the area under “Points count.” It’s advisable not to enter an unrealistically high number here, as remember, you’ll need to create separate maps for each point! I also set the minimum distance between points to achieve a more uniform spatial distribution. The result is a well-defined, regularly patterned set of points.
VLOS calculation for drone mapping
Perhaps generating a viewshed map poses the biggest challenge. Just think, manually running the “Viewshed” function for potentially 50 points and then calculating the extent of visible areas for each one. If this were to involve more potential locations or a higher sampling density, it could take days. But not for us! The lazy person – like myself – learns to automate processes and lets the computer do the work instead. Moreover, with code, an entire process becomes repeatable and verifiable. Let’s write a Python code to do the dirty work for us! 🙂
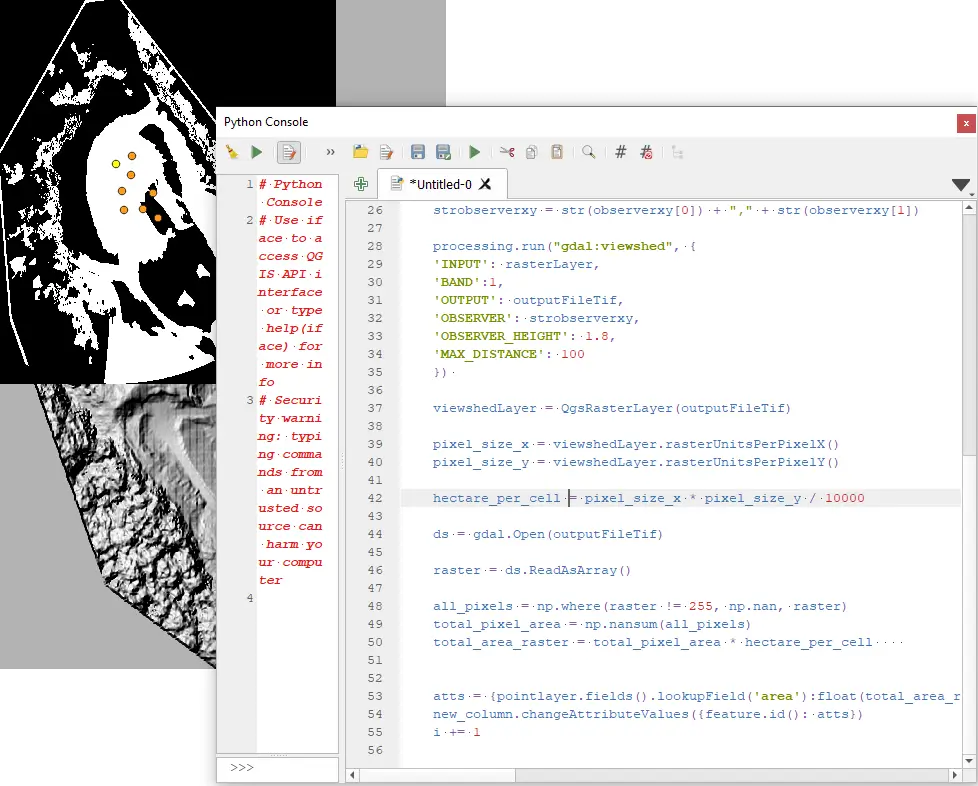
Open the “Python Console,” then press the “Show Editor” button. Copy the following code into the text area.
Sideote: Before you use the script, I will share some important information with you. By commenting in the code (the part of the text after the # sign), I indicated which variables you need to rewrite. So, going from top to bottom in the code: DEM layer name; the name of the layer containing the points; the absolute path to save the “viewshed” maps with the file name without the “.tif” extension. Be sure to enter the path with a normal slash “/” and not a backslash “\”.
The other important thing is that I wrote the code using GDAL functions. If you want to know more about it, you can read the detailed description here. I set the maximum VLOS distance (‘MAX_DISTANCE’) to 100 meters, the height of the drone (‘TARGET_HEIGHT’) to 50 meters, and the value of ‘OBSERVER_HEIGHT’ to 1.8 meters, i.e. the height of an average drone pilot. 🙂
You can also add the atmospheric effect to the GDAL viewshed function: ‘EXTRA’:’-cc 0.85714′, so you can achieve even more accurate results when calculating VLOS.
import processing
import numpy as np
from osgeo import gdal

i = 0

# Enter the name of the DEM layer
rasterLayer = QgsProject.instance().mapLayersByName('dem')[0]
# Enter the name of the Points layer
pointlayer = QgsProject.instance().mapLayersByName('Random points')[0]
# Enter the file path of the output raster
outputFile = 'C:/Users/.../YOUR FOLDER/viewshed'

new_column = pointlayer.dataProvider()
new_column.addAttributes([QgsField('area', QVariant.Double)])
pointlayer.updateFields()

iter = pointlayer.getFeatures()

for feature in iter:

    outputFileTif = outputFile + str(i) + '.tif'

    geom = feature.geometry()
    observerxy = geom.asPoint()
    strobserverxy = str(observerxy[0]) + "," + str(observerxy[1])

    processing.run("gdal:viewshed", {
    'INPUT': rasterLayer,
    'BAND':1,
    'OUTPUT': outputFileTif,
    'OBSERVER': strobserverxy,
    'OBSERVER_HEIGHT': 1.8,
    'MAX_DISTANCE': 100,
    'TARGET_HEIGHT': 50
    })
    viewshedLayer = QgsRasterLayer(outputFileTif)

    pixel_size_x = viewshedLayer.rasterUnitsPerPixelX()
    pixel_size_y = viewshedLayer.rasterUnitsPerPixelY()

    hectare_per_cell = pixel_size_x * pixel_size_y / 10000

    ds = gdal.Open(outputFileTif)

    raster = ds.ReadAsArray()


    all_pixels = np.where(raster != 255, np.nan, raster)
    total_pixel_area = np.nansum(all_pixels)
    total_area_raster = total_pixel_area * hectare_per_cell


    atts = {pointlayer.fields().lookupField('area'):float(total_area_raster)}
    new_column.changeAttributeValues({feature.id(): atts})
    i += 1
After setting everything, press the green triangle button (“Run Script”). The VLOS calculation runs within a few seconds.
SELECTION OF THE OPTIMAL LOCATION
After running the script, the result can be easily read from the map by opening the attribute table of the points. You can do this by right-clicking on the layer and selecting the “Open Attribute Table” option.
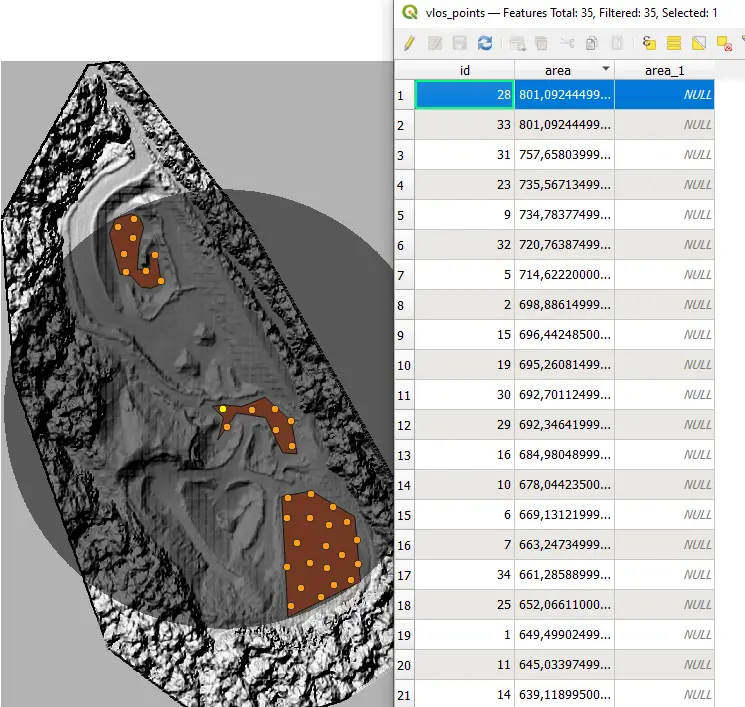
Double-click the header of the new column called “area” so that you can set the values in descending order. You then just have to click on the number at the beginning of the row, and then you can select the highest value. This means that the largest area is visible from this selected point. When writing the code, I defined the area units in hectares.
Sharing the drone mapping project plan
If you want to share the results of the VLOS calculation with someone, you can easily share these maps with SurveyTransfer. You can then also upload the results of the flight to your SurveyTransfer project, from where all of the project’s spatial data sets become available.
Download and view the SurveyTransfer demo “VLOS calculation” project:
If you really liked what you read, you can share it with your friends. 🙂
Did you like what you read? Do you want to read similar ones?